Introduction
Who am I?

A portrait of the author in the form he will assume over the course of this project, having returned to our time to warn his present self against pursuing this course of action.
My name is Nathan Douglas. The best source of information about my electronic life is probably my GitHub profile. It almost certainly would not be my LinkedIn profile. I also have a blog about non-computer-related stuff here.
What Do I Do?
 The author in his eventual form advising the author in his present form not to do the thing, and why.
I've been trying to get computers to do what I want, with mixed success, since the early mid-nineties. I earned my Bachelor's in Computer Science from the University of Nevada at Las Vegas in 2011, and I've been working as a software/DevOps engineer ever since, depending on gig.
I consider myself a DevOps Engineer. I consider DevOps a methodology and a role, in that I try to work in whatever capacity I can to improve the product delivery lifecycle and shorten delivery lead time. I generally do the work that is referred to as "DevOps" or "platform engineering" or "site reliability engineering", but I try to emphasize the theoretical aspects, e.g. Lean Management, sytems thinking, etc. That's not to say that I'm an expert, but just that I try to keep the technical details grounded in the philosophical justifications, the big picture.
Background
"What would you do if you had an AMD K6-2 333MHz and 96MB RAM?" "I'd run two copies of Windows 98, my dude."
At some point in the very early 00's, I believe, I first encountered VMWare and the idea that I could run a computer inside of another computer. That wasn't the first time I'd encountered a virtual machine -- I'd played with Java in the '90's, and played Zork and other Infocom and Inform games -- but it might've been the first time that I really understood the idea.
And I made use of it. For a long time – most of my twenties – I was occupied by a writing project. I maintained a virtual machine that ran a LAMP server and hosted various content management systems and related technologies: raw HTML pages, MediaWiki, DokuWiki, Drupal, etc, all to organize my thoughts on this and other projects. Along the way, I learned a whole lot about this sort of deployment: namely, that it was a pain in the ass.
I finally abandoned that writing project around the time Docker came out. I immediately understood what it was: a less tedious VM. (Admittedly, my understanding was not that sophisticated.) I built a decent set of skills with Docker and used it wherever I could. I thought Docker was about as good as it got.
At some point around 2016 or 2017, I became aware of Kubernetes. I immediately built a 4-node cluster with old PCs, doing a version of Kubernetes the Hard Way on bare metal, and then shifted to a custom system with four VMWare VMs that PXE booted, setup a CoreOS configuration with Ignition and what was then called Matchbox, and formed into a self-healing cluster with some neat toys like GlusterFS, etc. Eventually, though, I started neglecting the cluster and tore it down.
Around 2021, my teammates and I started considering a Kubernetes-based infrastructure for our applications, so I got back into it. I set up a rather complicated infrastructure on a three-node Proxmox VE cluster that would create three three-node Kubernetes clusters using LXC containers. From there I explored ArgoCD and GitOps and Helm and some other things that I hadn't really played with before. But again, my interest waned and the cluster didn't actually get much action.
A large part of this, I think, is that I didn't trust it to run high-FAF (Family Acceptance Factor) apps, like Plex, etc. After all, this was supposed to be a cluster I could tinker with, and tear down and destroy and rebuild at any time with a moment's notice. So in practice, this ended up being a toy cluster.
And while I'd gone through Kubernetes the Hard Way (twice!), I got the irritating feeling that I hadn't really learned all that much. I'd done Linux From Scratch, and had run Gentoo for several years, so I was no stranger to the idea of following a painfully manual process filled with shell commands and waiting for days for my computer to be useful again. And I did learn a lot from all three projects, but, for whatever reason, it didn't stick all that well.
Motivation
In late 2023, my team's contract concluded, and there was a possibility I might be laid off. My employer quickly offered me a position on another team, which I happily and gratefully accepted, but I had already applied to several other positions. I had some promising paths forward, but... not as many as I would like. It was an unnerving experience.
Not everyone is using Kubernetes, of course, but it's an increasingly essential skill in my field. There are other skills I have – Ansible, Terraform, Linux system administration, etc – but I'm not entirely comfortable with my knowledge of Kubernetes, so I'd like to deepen and broaden that as effectively as possible.
Goals
I want to get really good at Kubernetes. Not just administering it, but having a good understanding of what is going on under the hood at any point, and how best to inspect and troubleshoot and repair a cluster.
I want to have a fertile playground for experimenting; something that is not used for other purposes, not expected to be stable, ideally not even accessed by anyone else. Something I can do the DevOps equivalent of destroy with an axe, without consequences.
I want to document everything I've learned exhaustively. I don't want to take a command for granted, or copy and paste, or even copying and pasting after nodding thoughtfully at a wall of text. I want to embed things deeply into my thiccc skull.
Generally, I want to be beyond prepared for my CKA, CKAD, and CKS certification exams. I hate test anxiety. I hate feeling like there are gaps in my knowledge. I want to go in confident, and I want my employers and teammates to be confident of my abilities.
Approach
This is largely going to consist of me reading documentation and banging my head against the wall. I'll provide links to the relevant information, and type out the commands, but I also want to persist this in Infrastructure-as-Code. Consequently, I'll link to Ansible tasks/roles/playbooks for each task as well.
Cluster Hardware
I went with a PicoCluster 10H. I'm well aware that I could've cobbled something together and spent much less money; I have indeed done the thing with a bunch of Raspberry Pis screwed to a board and plugged into an Anker USB charger and a TP-Link switch.
I didn't want to do that again, though. For one, I've experienced problems with USB chargers seeming to lose power over time, and some small switches getting flaky when powered from USB. I liked the power supply of the PicoCluster and its cooling configuration. I liked that it did pretty much exactly what I wanted, and if I had problems I could yell at someone else about it rather than getting derailed by hardware rabbit holes.
I also purchased ten large heatsinks with fans, specifically these. There were others I liked a bit more, and these interfered with the standoffs that were used to build each stack of five Raspberry Pis, but these seemed as though they would likely be the most reliable in the long run.
I purchased SanDisk 128GB Extreme microSDXC cards for local storage. I've been using SanDisk cards for years with no significant issues or complaints.
The individual nodes are Raspberry Pi 4B/8GB. As of the time I'm writing this, Raspberry Pi 5s are out, and they offer very substantial benefits over the 4B. That said, they also have higher energy consumption, lower availability, and so forth. I'm opting for a lower likelihood of surprises because, again, I just don't want to spend much time dealing with hardware and I don't expect performance to hinder me.
Frequently Asked Questions
So, how do you like the PicoCluster so far?
I have no complaints. Putting it together was straightforward; the documentation was great, everything was labeled correctly, etc. Cooling seems very adequate and performance and appearance are perfect.
Have you considered adding SSDs for mass storage?
Yes, and I have some cables and spare SSDs for doing so. I'm not sure if I actually will. We'll see.
Meet the Nodes
It's generally frowned upon nowadays to treat servers like "pets" as opposed to "cattle". And, indeed, I'm trying not to personify these little guys too much, but... you can have my custom MOTD, hostnames, and prompts when you pry them from my cold, dead fingers.
The nodes are identified with a letter A-J and labeled accordingly on the ethernet port so that if one needs to be replaced or repaired, that can be done with a minimum of confusion. Then, I gave each the name of a noble house from A Song of Ice and Fire and gave it a MOTD (based on the coat of arms) and a themed Bash prompt.
In my experience, when I'm working in multiple servers simultaneously, it's good for me to have a bright warning sign letting me know, as unambiguously as possible, what server I'm actually logged in on. (I've never blown up prod thinking it was staging, but if I'm shelled into prod I'm deeply concerned about that possibility)
This is just me being a bit over-the-top, I guess.
✋ Allyrion
🐞 Bettley
🦢 Cargyll
🍋 Dalt
🦩 Erenford
🌺 Fenn
🧤 Gardener
🌳 Harlton
🏁 Inchfield
🦁 Jast
Node Configuration
After physically installing and setting up the nodes, the next step is to perform basic configuration. You can see the Ansible playbook I use for this, which currently runs the following roles:
goldentooth.configure:- Set timezone; last thing I need to do when working with computers is having to perform arithmetic on times and dates.
- Set keybord layout; this should be set already, but I want to be sure.
- Enable overclocking; I've installed an adequate cooling system to support the Pis running full-throttle at their full spec clock.
- Enable fan control; the heatsinks I've installed include fans to prevent CPU throttling under heavy load.
- Enable and configure certain cgroups; this allows Kubernetes to manage and limit resources on the system.
cpuset: This is used to manage the assignment of individual CPUs (both physical and logical) and memory nodes to tasks running in a cgroup. It allows for pinning processes to specific CPUs and memory nodes, which can be very useful in a containerized environment for performance tuning and ensuring that certain processes have dedicated CPU time. Kubernetes can use cpuset to ensure that workloads (containers/pods) have dedicated processing resources. This is particularly important in multi-tenant environments or when running workloads that require guaranteed CPU cycles. By controlling CPU affinity and ensuring that processes are not competing for CPU time, Kubernetes can improve the predictability and efficiency of applications.memory: This is used to limit the amount of memory that tasks in a cgroup can use. This includes both RAM and swap space. It provides mechanisms to monitor memory usage and enforce hard or soft limits on the memory available to processes. When a limit is reached, the cgroup can trigger OOM (Out of Memory) killer to select and kill processes exceeding their allocation. Kubernetes uses the memory cgroup to enforce memory limits specified for pods and containers, preventing a single workload from consuming all available memory, which could lead to system instability or affect other workloads. It allows for better resource isolation, efficient use of system resources, and ensures that applications adhere to their specified resource limits, promoting fairness and reliability.hugetlb: This is used to manage huge pages, a feature of modern operating systems that allows the allocation of memory in larger blocks (huge pages) compared to standard page sizes. This can significantly improve performance for certain workloads by reducing the overhead of page translation and increasing TLB (Translation Lookaside Buffer) hits. Some applications, particularly those dealing with large datasets or high-performance computing tasks, can benefit significantly from using huge pages. Kubernetes can use it to allocate huge pages to these workloads, improving performance and efficiency. This is not going to be a concern for my use, but I'm enabling it anyway simply because it's recommended.
- Disable swap. Kubernetes doesn't like swap by default, and although this can be worked around, I'd prefer to avoid swapping on SD cards. I don't really expect a high memory pressure condition anyway.
- Set preferred editor; I like
nano, although I can (after years of practice) safely and reliably exitvi. - Set certain kernel modules to load at boot:
overlay: This supports OverlayFS, a type of union filesystem. It allows one filesystem to be overlaid on top of another, combining their contents. In the context of containers, OverlayFS can be used to create a layered filesystem that combines multiple layers into a single view, making it efficient to manage container images and writable container layers.br_netfilter: This allows bridged network traffic to be filtered by iptables and ip6tables. This is essential for implementing network policies, including those related to Network Address Translation (NAT), port forwarding, and traffic filtering. Kubernetes uses it to enforce network policies that control ingress and egress traffic to pods and between pods. This is crucial for maintaining the security and isolation of containerized applications. It also enables the necessary manipulation of traffic for services to direct traffic to pods, and for pods to communicate with each other and the outside world. This includes the implementation of services, load balancing, and NAT for pod networking. And by allowing iptables to filter bridged traffic, br_netfilter helps Kubernetes manage network traffic more efficiently, ensuring consistent network performance and reliability across the cluster.
- Load above kernel modules on every boot.
- Set some kernel parameters:
net.bridge.bridge-nf-call-iptables: This allows iptables to inspect and manipulate the traffic that passes through a Linux bridge. A bridge is a way to connect two network segments, acting somewhat like a virtual network switch. When enabled, it allows iptables rules to be applied to traffic coming in or going out of a bridge, effectively enabling network policies, NAT, and other iptables-based functionalities for bridged traffic. This is essential in Kubernetes for implementing network policies that control access to and from pods running on the same node, ensuring the necessary level of network isolation and security.net.bridge.bridge-nf-call-ip6tables: As above, but for IPv6 traffic.net.ipv4.ip_forward: This controls the ability of the Linux kernel to forward IP packets from one network interface to another, a fundamental capability for any router or gateway. Enabling IP forwarding is crucial for a node to route traffic between pods, across different nodes, or between pods and the external network. It allows the node to act as a forwarder or router, which is essential for the connectivity of pods across the cluster, service exposure, and for pods to access the internet or external resources when necessary.
- Add SSH public key to
root's authorized keys; this is already performed for my normal user by Raspberry Pi Imager.
goldentooth.set_hostname: Set the hostname of the node (including a line in/etc/hosts). This doesn't need to be a separate role, obviously. I just like the structure as I have it.goldentooth.set_motd: Set the MotD, as described in the previous chapter.goldentooth.set_bash_prompt: Set the Bash prompt, as described in the previous chapter.goldentooth.setup_security: Some basic security configuration. Currently, this just uses Jeff Geerling'sansible-role-securityto perform some basic tasks, like setting up unattended upgrades, etc, but I might expand this in the future.
Raspberry Pi Imager doesn't allow you to specify an SSH key for the root user, so I do this in goldentooth.configure. However, I also have Kubespray installed (for when I want things to Just Work™), and Kubespray expects the remote user to be root. As a result, I specify that the remote user is my normal user account in the configure_cluster playbook. This means a lot of become: true in the roles, but I would prefer eventually to ditch Kubespray and disallow root login via SSH.
Anyway, we need to rerun goldentooth.set_bash_prompt, but as the root user. This almost never matters, since I prefer to SSH as a normal user and use sudo, but I like my prompts and you can't take them away from me.
With the nodes configured, we can start talking about the different roles they will serve.
Cluster Roles and Responsibilities
Observations:
- The cluster has a single power supply but two power distribution units (PDUs) and two network switches, so it seems reasonable to segment the cluster into left and right halves.
- I want high availability, which requires a control plane capable of a quorum, so a minimum of three nodes in the control plane.
- I want to use a dedicated external load balancer for the control plane rather than configure my existing Opnsense firewall/router. (I'll have to do that to enable MetalLB via BGP, sadly.)
- So that would yield one load balancer, three control plane nodes, and six worker nodes.
- With the left-right segmentation, I can locate one load balancer and one control plane node on the left side, two control plane nodes on the right side, and three worker nodes on each side.
This isn't really high-availability; the cluster has multiple single points of failure:
- the load balancer node
- whichever network switch is connected to the upstream
- the power supply
- the PDU powering the LB
- the PDU powering the upstream switch
- etc.
That said, I find those acceptable given the nature of this project.
Load Balancer
Allyrion, the first node alphabetically and the top node on the left side, will run a load balancer. I had a number of options here, but I ended up going with HAProxy. HAProxy was my introduction to load balancing, reverse proxying, and so forth, and I have kind of a soft spot for it.
I'd also considered Traefik, which I use elsewhere in my homelab, but I believe I'll use it as an ingress controller. Similarly, I think I prefer to use Nginx on a per-application level. I'm pursuing this project first and foremost to learn and to document my learning, and I'd prefer to cover as much ground as possible, and as clearly as possible, and I believe I can do this best if I don't have to worry about having to specify which installation of $proxy I'm referring to at any given time.
So:
- HAProxy: Load balancer
- Traefik: Ingress controller
- Nginx: Miscellaneous
Control Plane
Bettley (the second node on the left side), Gardener, and Harlton (the first and second nodes on the right side) will be the control plane nodes.
It's common, in small home Kubernetes clusters, to remove the control plane taint (node-role.kubernetes.io/control-plane) to allow miscellaneous pods to be scheduled on the control plane nodes. I won't be doing that here; six worker nodes should be sufficient for my purposes, and I'll try (where possible and practical) to follow best practices. That said, I might find some random fun things to run on my control plane nodes, and I'll adjust their tolerations accordingly.
Workers
The remaining nodes (Cargyll, Dalt, and Erenford on the left, and Harlton, Inchfield, and Jast on the right) are dedicated workers. What sort of workloads will they run?
Well, probably nothing interesting. Not Plex, not torrent clients or *darrs. Mostly logging, metrics, and similar. I'll probably end up gathering a lot of data about data. And that's fine – these Raspberry Pis are running off SD cards; I don't really want them to be doing anything interesting anyway.
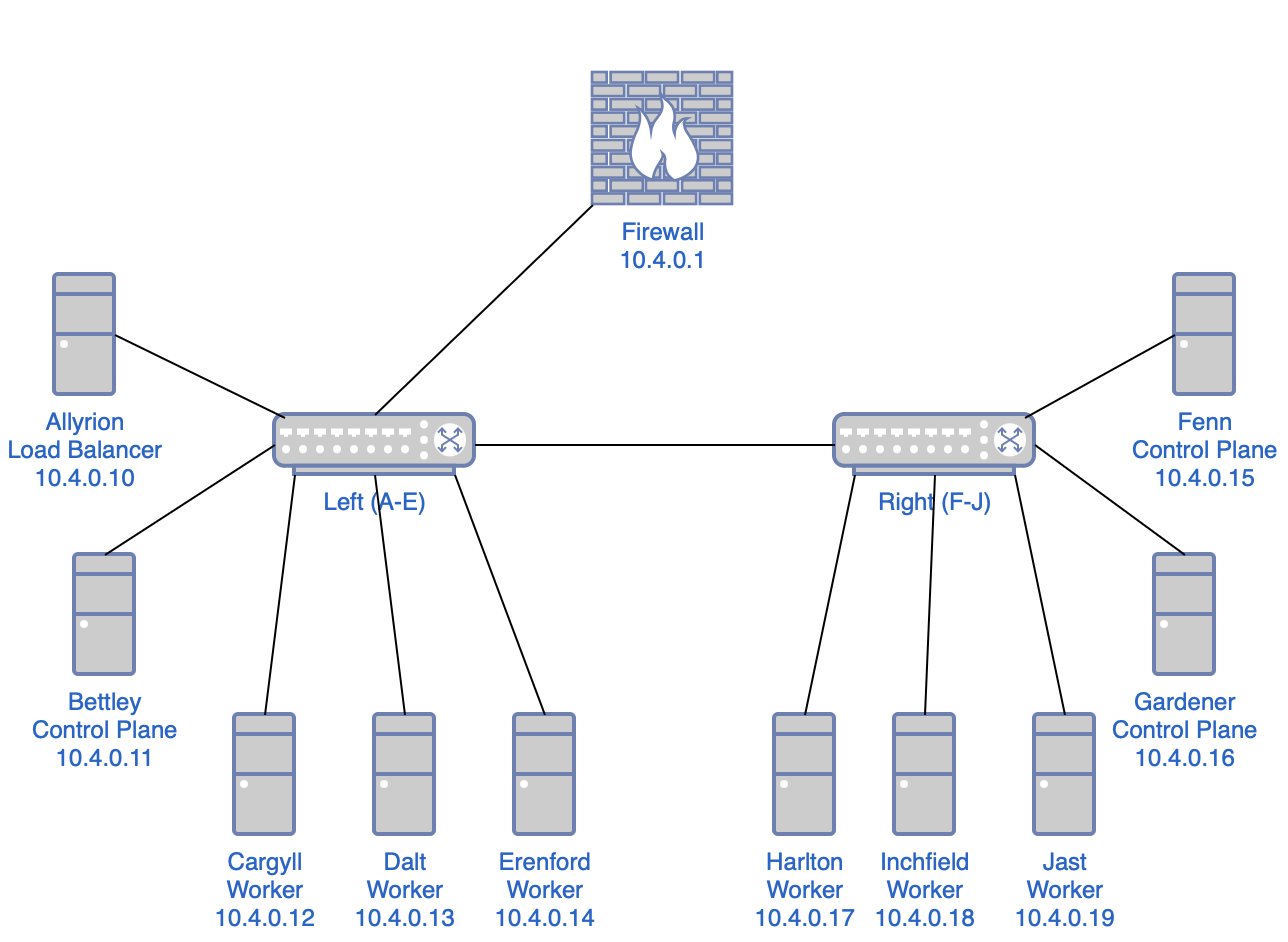
Network Topology
In case you don't quite have a picture of the infrastructure so far, it should look like this:
Frequently Asked Questions
Why didn't you make Etcd high-availability?
It seems like I'd need that cluster to have a quorum too, so we're talking about three nodes for the control plane, three nodes for Etcd, one for the load balancer, and, uh, three worker nodes. That's a bit more than I'd like to invest, and I'd like to avoid doubling up anywhere (although I'll probably add additional functionality to the load balancer). I'm interested in the etcd side of things, but not really enough to compromise elsewhere. I could be missing something obvious, though; if so, please let me know.
Why didn't you just do A=load balancer, B-D=control plane, and E-J=workers?
I could've and should've and still might. But because I'm a bit of a fool and wasn't really paying attention, I put A-E on the left and F-J on the right, rather than A,C,E,G,I on the left and B,D,F,H,J on the right, which would've been a bit cleaner. As it is, I need to think a second about which nodes are control nodes, since they aren't in a strict alphabetical order.
I might adjust this in the future; it should be easy to do so, after all, I just don't particularly want to take the cluster apart and rebuild it, especially since the standoffs were kind of messy as a consequence of the heatsinks.
Load Balancer
This cluster should have a high-availability control plane, and we can start laying the groundwork for that immediately.
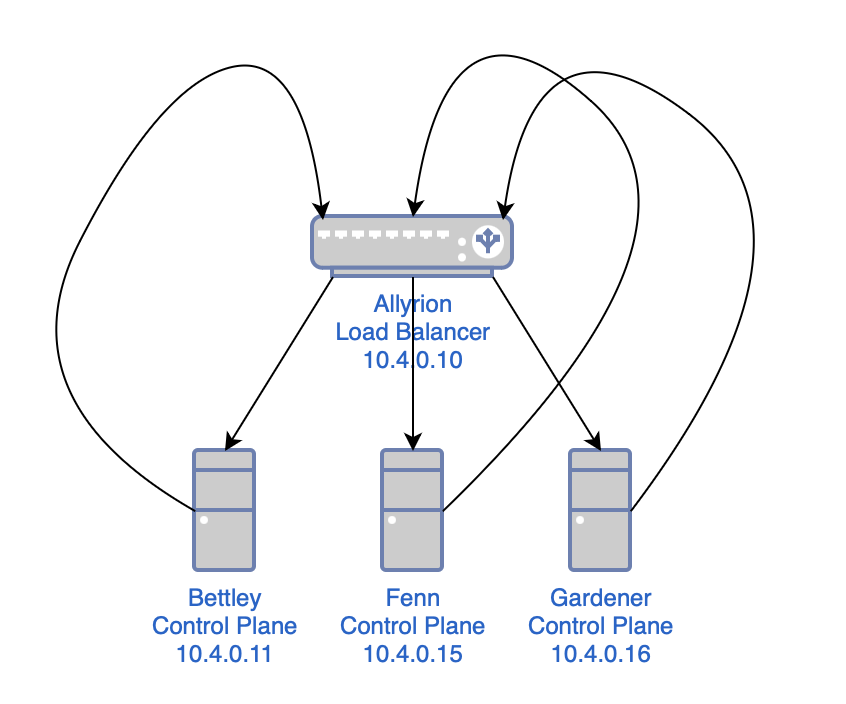
This might sound complex, but all we're doing is:
- creating a load balancer
- configuring the load balancer to use all of the control plane nodes as a list of backends
- telling anything that sends requests to a control plane node to send them to the load balancer instead
As mentioned before, we're using HAProxy as a load balancer. First, though, I'll install rsyslog, a log processing system. It will gather logs from HAProxy and deposit them in a more ergonomic location.
$ sudo apt install -y rsyslog
At least at the time of writing (February 2024), rsyslog on Raspberry Pi OS includes a bit of configuration that relocates HAProxy logs:
# /etc/rsyslog.d/49-haproxy.conf

# Create an additional socket in haproxy's chroot in order to allow logging via
# /dev/log to chroot'ed HAProxy processes
$AddUnixListenSocket /var/lib/haproxy/dev/log

# Send HAProxy messages to a dedicated logfile
:programname, startswith, "haproxy" {
  /var/log/haproxy.log
  stop
}
In Raspberry Pi OS, installing and configuring HAProxy is a simple matter.
$ sudo apt install -y haproxy
Here is the configuration I'm working with for HAProxy at the time of writing (February 2024); I've done my best to comment it thoroughly. You can also see the Jinja2 template and the role that deploys the template to configure HAProxy.
# /etc/haproxy/haproxy.cfg

# This is the HAProxy configuration file for the load balancer in my Kubernetes
# cluster. It is used to load balance the API server traffic between the
# control plane nodes.

# Global parameters
global
  # Sets uid for haproxy process.
  user haproxy
  # Sets gid for haproxy process.
  group haproxy
  # Sets the maximum per-process number of concurrent connections.
  maxconn 4096
  # Configure logging.
  log /dev/log local0
  log /dev/log local1 notice

# Default parameters
defaults
  # Use global log configuration.
  log global

# Frontend configuration for the HAProxy stats page.
frontend stats-frontend
  # Listen on all IPv4 addresses on port 8404.
  bind *:8404
  # Use HTTP mode.
  mode http
  # Enable the stats page.
  stats enable
  # Set the URI to access the stats page.
  stats uri /stats
  # Set the refresh rate of the stats page.
  stats refresh 10s
  # Set the realm to access the stats page.
  stats realm HAProxy\ Statistics
  # Set the username and password to access the stats page.
  stats auth nathan:<redacted>
  # Hide HAProxy version to improve security.
  stats hide-version

# Kubernetes API server frontend configuration.
frontend k8s-api-server
  # Listen on the IPv4 address of the load balancer on port 6443.
  bind 10.4.0.10:6443
  # Use TCP mode, which means that the connection will be passed to the server
  # without TLS termination, etc.
  mode tcp
  # Enable logging of the client's IP address and port.
  option tcplog
  # Use the Kubernetes API server backend.
  default_backend k8s-api-server

# Kubernetes API server backend configuration.
backend k8s-api-server
  # Use TCP mode, not HTTPS.
  mode tcp
  # Sets the maximum time to wait for a connection attempt to a server to
  # succeed.
  timeout connect 10s
  # Sets the maximum inactivity time on the client side. I might reduce this at
  # some point.
  timeout client 86400s
  # Sets the maximum inactivity time on the server side. I might reduce this at
  # some point.
  timeout server 86400s
  # Sets the load balancing algorithm.
  # `roundrobin` means that each server is used in turns, according to their
  # weights.
  balance roundrobin
  # Enable health checks.
  option tcp-check
  # For each control plane node, add a server line with the node's hostname and
  # IP address.
  # The `check` parameter enables health checks.
  # The `fall` parameter sets the number of consecutive health check failures
  # after which the server is considered to be down.
  # The `rise` parameter sets the number of consecutive health check successes
  # after which the server is considered to be up.
  server bettley 10.4.0.11:6443 check fall 3 rise 2
  server fenn 10.4.0.15:6443 check fall 3 rise 2
  server gardener 10.4.0.16:6443 check fall 3 rise 2
This enables the HAProxy stats frontend, which allows us to gain some insight into the operation of the frontend in something like realtime.
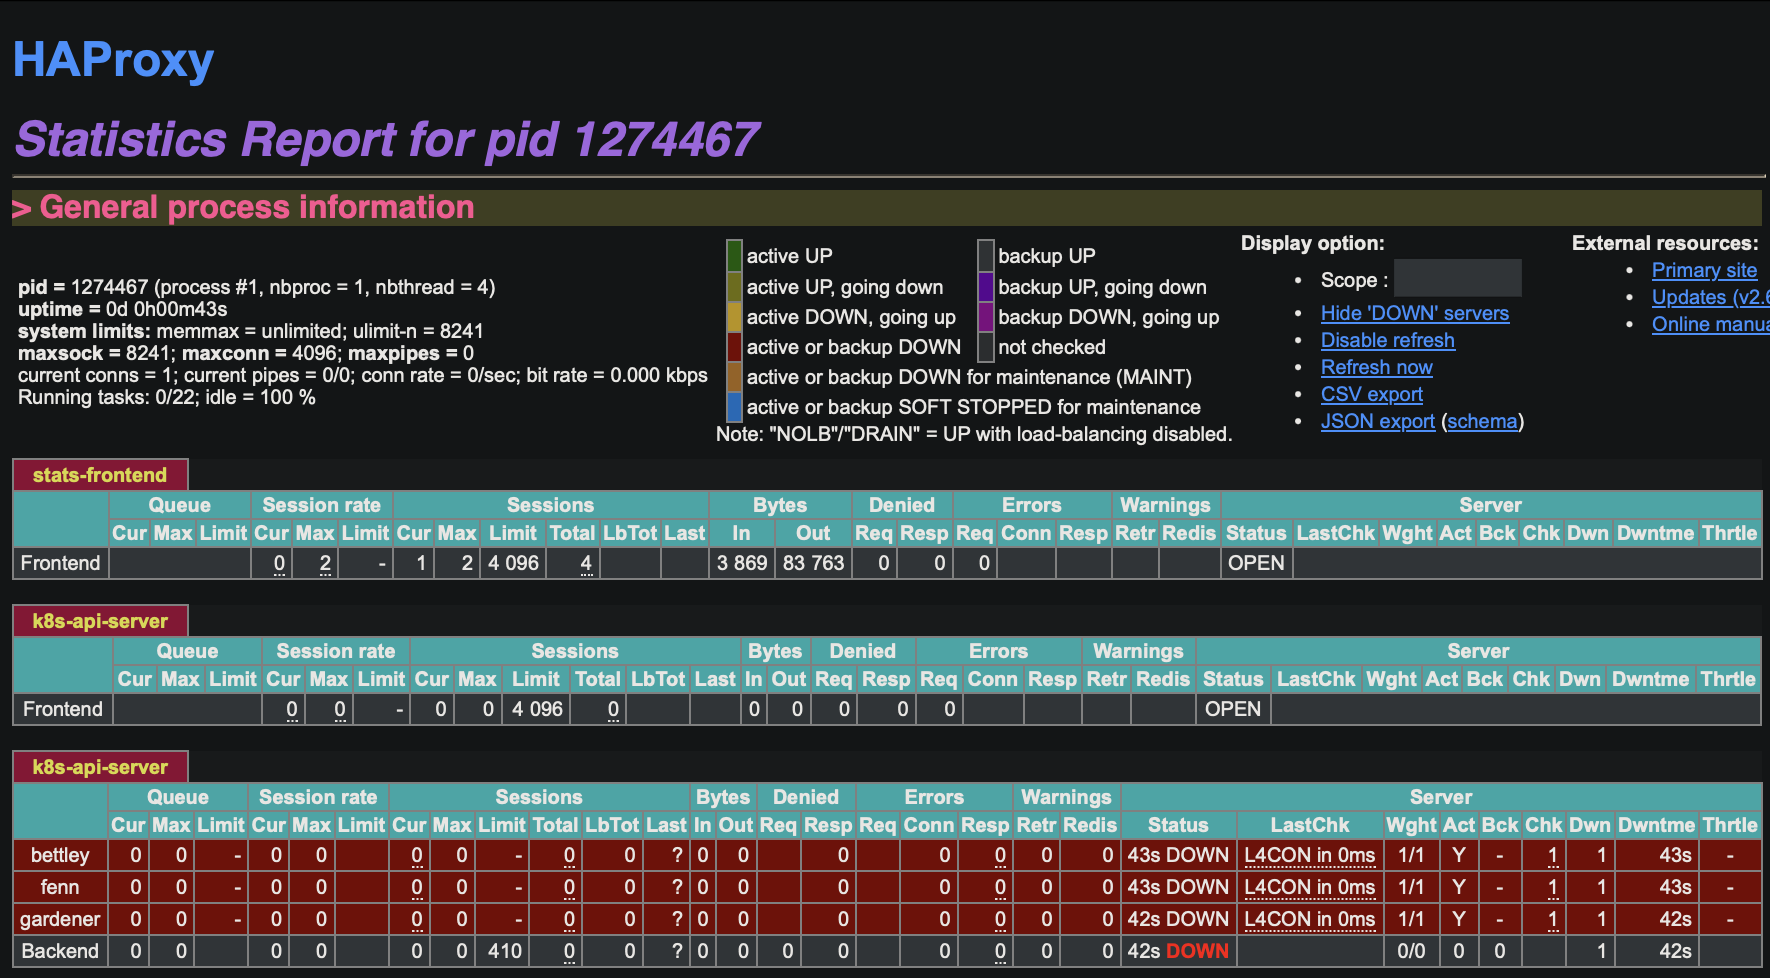
We see that our backends are unavailable, which is of course expected at this time. We can also read the logs, in /var/log/haproxy.log:
$ cat /var/log/haproxy.log
2024-02-21T07:03:16.603651-05:00 allyrion haproxy[1305383]: [NOTICE]   (1305383) : haproxy version is 2.6.12-1+deb12u1
2024-02-21T07:03:16.603906-05:00 allyrion haproxy[1305383]: [NOTICE]   (1305383) : path to executable is /usr/sbin/haproxy
2024-02-21T07:03:16.604085-05:00 allyrion haproxy[1305383]: [WARNING]  (1305383) : Exiting Master process...
2024-02-21T07:03:16.607180-05:00 allyrion haproxy[1305383]: [ALERT]    (1305383) : Current worker (1305385) exited with code 143 (Terminated)
2024-02-21T07:03:16.607558-05:00 allyrion haproxy[1305383]: [WARNING]  (1305383) : All workers exited. Exiting... (0)
2024-02-21T07:03:16.771133-05:00 allyrion haproxy[1305569]: [NOTICE]   (1305569) : New worker (1305572) forked
2024-02-21T07:03:16.772082-05:00 allyrion haproxy[1305569]: [NOTICE]   (1305569) : Loading success.
2024-02-21T07:03:16.775819-05:00 allyrion haproxy[1305572]: [WARNING]  (1305572) : Server k8s-api-server/bettley is DOWN, reason: Layer4 connection problem, info: "Connection refused at initial connection step of tcp-check", check duration: 0ms. 2 active and 0 backup servers left. 0 sessions active, 0 requeued, 0 remaining in queue.
2024-02-21T07:03:16.776309-05:00 allyrion haproxy[1305572]: Server k8s-api-server/bettley is DOWN, reason: Layer4 connection problem, info: "Connection refused at initial connection step of tcp-check", check duration: 0ms. 2 active and 0 backup servers left. 0 sessions active, 0 requeued, 0 remaining in queue.
2024-02-21T07:03:16.776584-05:00 allyrion haproxy[1305572]: Server k8s-api-server/bettley is DOWN, reason: Layer4 connection problem, info: "Connection refused at initial connection step of tcp-check", check duration: 0ms. 2 active and 0 backup servers left. 0 sessions active, 0 requeued, 0 remaining in queue.
2024-02-21T07:03:17.423831-05:00 allyrion haproxy[1305572]: [WARNING]  (1305572) : Server k8s-api-server/fenn is DOWN, reason: Layer4 connection problem, info: "Connection refused at initial connection step of tcp-check", check duration: 0ms. 1 active and 0 backup servers left. 0 sessions active, 0 requeued, 0 remaining in queue.
2024-02-21T07:03:17.424229-05:00 allyrion haproxy[1305572]: Server k8s-api-server/fenn is DOWN, reason: Layer4 connection problem, info: "Connection refused at initial connection step of tcp-check", check duration: 0ms. 1 active and 0 backup servers left. 0 sessions active, 0 requeued, 0 remaining in queue.
2024-02-21T07:03:17.424446-05:00 allyrion haproxy[1305572]: Server k8s-api-server/fenn is DOWN, reason: Layer4 connection problem, info: "Connection refused at initial connection step of tcp-check", check duration: 0ms. 1 active and 0 backup servers left. 0 sessions active, 0 requeued, 0 remaining in queue.
2024-02-21T07:03:17.653803-05:00 allyrion haproxy[1305572]: Connect from 10.0.2.162:53155 to 10.4.0.10:8404 (stats-frontend/HTTP)
2024-02-21T07:03:17.677482-05:00 allyrion haproxy[1305572]: Connect from 10.0.2.162:53156 to 10.4.0.10:8404 (stats-frontend/HTTP)
2024-02-21T07:03:18.114561-05:00 allyrion haproxy[1305572]: [WARNING]  (1305572) : Server k8s-api-server/gardener is DOWN, reason: Layer4 connection problem, info: "Connection refused at initial connection step of tcp-check", check duration: 0ms. 0 active and 0 backup servers left. 0 sessions active, 0 requeued, 0 remaining in queue.
2024-02-21T07:03:18.115141-05:00 allyrion haproxy[1305572]: [ALERT]    (1305572) : backend 'k8s-api-server' has no server available!
2024-02-21T07:03:18.115560-05:00 allyrion haproxy[1305572]: Server k8s-api-server/gardener is DOWN, reason: Layer4 connection problem, info: "Connection refused at initial connection step of tcp-check", check duration: 0ms. 0 active and 0 backup servers left. 0 sessions active, 0 requeued, 0 remaining in queue.
2024-02-21T07:03:18.116133-05:00 allyrion haproxy[1305572]: Server k8s-api-server/gardener is DOWN, reason: Layer4 connection problem, info: "Connection refused at initial connection step of tcp-check", check duration: 0ms. 0 active and 0 backup servers left. 0 sessions active, 0 requeued, 0 remaining in queue.
2024-02-21T07:03:18.117560-05:00 allyrion haproxy[1305572]: backend k8s-api-server has no server available!
2024-02-21T07:03:18.118458-05:00 allyrion haproxy[1305572]: backend k8s-api-server has no server available!
This is fine and dandy, and will be addressed in future chapters.
Container Runtime
Kubernetes is a container orchestration platform and therefore requires some container runtime to be installed.
This is a simple step; containerd is well-supported, well-regarded, and I don't have any reason not to use it.
I used Jeff Geerling's Ansible role to install and configure containerd on my cluster; this is really the point at which some kind of IaC/configuration management system becomes something more than a polite suggestion 🙂
That said, the actual steps are not very demanding (aside from the fact that they will need to be executed once on each Kubernetes host). They intersect largely with Docker Engine's installation instructions (since Docker, not the Containerd project, maintains the package repository), which I won't repeat here.
The container runtime installation is handled in my install_k8s_packages.yaml playbook, which is where we'll be spending some time in subsequent sections.
Networking
Kubernetes uses three different networks:
- Infrastructure: The physical or virtual backbone connecting the machines hosting the nodes. The infrastructure network enables connectivity between the nodes; this is essential for the Kubernetes control plane components (like the kube-apiserver, etcd, scheduler, and controller-manager) and the worker nodes to communicate with each other. Although pods communicate with each other via the pod network (overlay network), the underlying infrastructure network supports this by facilitating the physical or virtual network paths between nodes.
- Service: This is a purely virtual and internal network. It allows services to communicate with each other and with Pods seamlessly. This network layer abstracts the actual network details from the services, providing a consistent and simplified interface for inter-service communication. When a Service is created, it is automatically assigned a unique IP address from the service network's address space. This IP address is stable for the lifetime of the Service, even if the Pods that make up the Service change. This stable IP address makes it easier to configure DNS or other service discovery mechanisms.
- Pod: This is a crucial component that allows for seamless communication between pods across the cluster, regardless of which node they are running on. This networking model is designed to ensure that each pod gets its own unique IP address, making it appear as though each pod is on a flat network where every pod can communicate with every other pod directly without NAT.
My infrastructure network is already up and running at 10.4.0.0/20. I'll configure my service network at 172.16.0.0/20 and my pod network at 192.168.0.0/16.
With this decided, we can move forward.
Configuring Packages
Rather than YOLOing binaries onto our nodes like heathens, we'll use Apt and Ansible.
I wrote the above line before a few hours or so of fighting with Apt, Ansible, the repository signing key, documentation on the greater internet, my emotions, etc.
The long and short of it is that apt-key add is deprecated in Debian and Ubuntu, and consequently ansible.builtin.apt_key should be deprecated, but cannot be at this time for backward compatibility with older versions of Debian and Ubuntu and other derivative distributions.
The reason for this deprecation, as I understand it, is that apt-key add adds a key to /etc/apt/trusted.gpg.d. Keys here can be used to sign any package, including a package downloaded from an official distro package repository. This weakens our defenses against supply-chain attacks.
The new recommendation is to add the key to /etc/apt/keyrings, where it will be used when appropriate but not, apparently, to sign for official distro package repositories.
A further complication is that the Kubernetes project has moved its package repositories a time or two and completely rewrote the repository structure.
As a result, if you Google™, you will find a number of ways of using Ansible or a shell command to configure the Kubernetes apt repository on Debian/Ubuntu/Raspberry Pi OS, but none of them are optimal.
The Desired End-State
Here are my expectations:
- use the new deb822 format, not the old sources.list format
- preserve idempotence
- don't point to deprecated package repositories
- actually work
Existing solutions failed at one or all of these.
For the record, what we're trying to create is:
- a file located at
/etc/apt/keyrings/kubernetes.asccontaining the Kubernetes package repository signing key - a file located at
/etc/apt/sources.list.d/kubernetes.sourcescontaining information about the Kubernetes package repository.
The latter should look something like the following:
X-Repolib-Name: kubernetes
Types: deb
URIs: https://pkgs.k8s.io/core:/stable:/v1.29/deb/
Suites: /
Architectures: arm64
Signed-By: /etc/apt/keyrings/kubernetes.asc
The Solution
After quite some time and effort and suffering, I arrived at a solution.
You can review the original task file for changes, but I'm embedding it here because it was weirdly a nightmare to arrive at a working solution.
I've edited this only to substitute strings for the variables that point to them, so it should be a working solution more-or-less out-of-the-box.
---
- name: 'Install packages needed to use the Kubernetes Apt repository.'
  ansible.builtin.apt:
    name:
      - 'apt-transport-https'
      - 'ca-certificates'
      - 'curl'
      - 'gnupg'
      - 'python3-debian'
    state: 'present'

- name: 'Add Kubernetes repository.'
  ansible.builtin.deb822_repository:
    name: 'kubernetes'
    types:
      - 'deb'
    uris:
      - "https://pkgs.k8s.io/core:/stable:/v1.29/deb/"
    suites:
      - '/'
    architectures:
      - 'arm64'
    signed_by: "https://pkgs.k8s.io/core:/stable:/v1.29/deb/Release.key"
After this, you will of course need to update your Apt cache and install the three Kubernetes tools we'll use shortly: kubeadm, kubectl, and kubelet.
Installing Packages
Now that we have functional access to the Kubernetes Apt package repository, we can install some important Kubernetes tools:
kubeadmprovides a straightforward way to setup and configure a Kubernetes cluster (API server, Controller Manager, DNS, etc). Kubernetes the Hard Way basically does whatkubeadmdoes. I usekubeadmbecause my goal is to go not necessarily deeper, but farther.kubectlis a CLI tool for administering a Kubernetes cluster; you can deploy applications, inspect resources, view logs, etc. As I'm studying for my CKA, I want to usekubectlfor as much as possible.kubeletruns on each and every node in the cluster and ensures that pods are functioning as desired and takes steps to correct their behavior when it does not match the desired state.
Installing these tools is comparatively simple, just sudo apt-get install -y kubeadm kubectl kubelet, or as covered in the relevant role.
kubeadm init
kubeadm does a wonderful job of simplifying Kubernetes cluster bootstrapping (if you don't believe me, just read Kubernetes the Hard Way), but there's still a decent amount of work involved. Since we're creating a high-availability cluster, we need to do some magic to convey secrets between the control plane nodes, generate join tokens for the worker nodes, etc.
So, we will:
- run
kubeadmon the first control plane node - copy some data around
- run a different
kubeadmcommand to join the rest of the control plane nodes to the cluster - copy some more data around
- run a different
kubeadmcommand to join the worker nodes to the cluster
and then we're done!
kubeadm init takes a number of command-line arguments.
You can look at the actual Ansible tasks bootstrapping my cluster, but this is what my command evaluates out to:
kubeadm init \
  --control-plane-endpoint="10.4.0.10:6443" \
  --kubernetes-version="stable-1.29" \
  --service-cidr="172.16.0.0/20" \
  --pod-network-cidr="192.168.0.0/16" \
  --cert-dir="/etc/kubernetes/pki" \
  --cri-socket="unix:///var/run/containerd/containerd.sock" \
  --upload-certs
I'll break that down line by line:
# Run through all of the phases of initializing a Kubernetes control plane.
kubeadm init \
  # Requests should target the load balancer, not this particular node.
  --control-plane-endpoint="10.4.0.10:6443" \
  # We don't need any more instability than we already have.
  # At time of writing, 1.29 is the current release.
  --kubernetes-version="stable-1.29" \
  # As described in the chapter on Networking, this is the CIDR from which
  # service IP addresses will be allocated.
  # This gives us 4,094 IP addresses to work with.
  --service-cidr="172.16.0.0/20" \
  # As described in the chapter on Networking, this is the CIDR from which
  # pod IP addresses will be allocated.
  # This gives us 65,534 IP addresses to work with.
  --pod-network-cidr="192.168.0.0/16"
  # This is the directory that will host TLS certificates, keys, etc for
  # cluster communication.
  --cert-dir="/etc/kubernetes/pki"
  # This is the URI of the container runtime interface socket, which allows
  # direct interaction with the container runtime.
  --cri-socket="unix:///var/run/containerd/containerd.sock"
  # Upload certificates into the appropriate secrets, rather than making us
  # do that manually.
  --upload-certs
Oh, you thought I was just going to blow right by this, didncha? No, this ain't Kubernetes the Hard Way, but I do want to make an effort to understand what's going on here. So here, courtesy of kubeadm init --help, is the list of phases that kubeadm runs through by default.
preflight                    Run pre-flight checks
certs                        Certificate generation
  /ca                          Generate the self-signed Kubernetes CA to provision identities for other Kubernetes components
  /apiserver                   Generate the certificate for serving the Kubernetes API
  /apiserver-kubelet-client    Generate the certificate for the API server to connect to kubelet
  /front-proxy-ca              Generate the self-signed CA to provision identities for front proxy
  /front-proxy-client          Generate the certificate for the front proxy client
  /etcd-ca                     Generate the self-signed CA to provision identities for etcd
  /etcd-server                 Generate the certificate for serving etcd
  /etcd-peer                   Generate the certificate for etcd nodes to communicate with each other
  /etcd-healthcheck-client     Generate the certificate for liveness probes to healthcheck etcd
  /apiserver-etcd-client       Generate the certificate the apiserver uses to access etcd
  /sa                          Generate a private key for signing service account tokens along with its public key
kubeconfig                   Generate all kubeconfig files necessary to establish the control plane and the admin kubeconfig file
  /admin                       Generate a kubeconfig file for the admin to use and for kubeadm itself
  /super-admin                 Generate a kubeconfig file for the super-admin
  /kubelet                     Generate a kubeconfig file for the kubelet to use *only* for cluster bootstrapping purposes
  /controller-manager          Generate a kubeconfig file for the controller manager to use
  /scheduler                   Generate a kubeconfig file for the scheduler to use
etcd                         Generate static Pod manifest file for local etcd
  /local                       Generate the static Pod manifest file for a local, single-node local etcd instance
control-plane                Generate all static Pod manifest files necessary to establish the control plane
  /apiserver                   Generates the kube-apiserver static Pod manifest
  /controller-manager          Generates the kube-controller-manager static Pod manifest
  /scheduler                   Generates the kube-scheduler static Pod manifest
kubelet-start                Write kubelet settings and (re)start the kubelet
upload-config                Upload the kubeadm and kubelet configuration to a ConfigMap
  /kubeadm                     Upload the kubeadm ClusterConfiguration to a ConfigMap
  /kubelet                     Upload the kubelet component config to a ConfigMap
upload-certs                 Upload certificates to kubeadm-certs
mark-control-plane           Mark a node as a control-plane
bootstrap-token              Generates bootstrap tokens used to join a node to a cluster
kubelet-finalize             Updates settings relevant to the kubelet after TLS bootstrap
  /experimental-cert-rotation  Enable kubelet client certificate rotation
addon                        Install required addons for passing conformance tests
  /coredns                     Install the CoreDNS addon to a Kubernetes cluster
  /kube-proxy                  Install the kube-proxy addon to a Kubernetes cluster
show-join-command            Show the join command for control-plane and worker node
So now I will go through each of these in turn to explain how the cluster is created.
kubeadm init phases
preflight
The preflight phase performs a number of checks of the environment to ensure it is suitable. These aren't, as far as I can tell, documented anywhere -- perhaps because documentation would inevitably drift out of sync with the code rather quickly. And, besides, we're engineers and this is an open-source project; if we care that much, we can just read the source code!
But I'll go through and mention a few of these checks, just for the sake of discussion and because there are some important concepts.
- Networking: It checks that certain ports are available and firewall settings do not prevent communication.
- Container Runtime: It requires a container runtime, since... Kubernetes is a container orchestration platform.
- Swap: Historically, Kubernetes has balked at running on a system with swap enabled, for performance and stability reasons, but this has been lifted recently.
- Uniqueness: It checks that each hostname is different in order to prevent networking conflicts.
- Kernel Parameters: It checks for certain cgroups (see the Node configuration chapter for more information). It used to check for some networking parameters as well, to ensure traffic can flow properly, but it appears this might not be a thing anymore in 1.30.
certs
This phase generates important certificates for communication between cluster components.
/ca
This generates a self-signed certificate authority that will be used to provision identities for all of the other Kubernetes components, and lays the groundwork for the security and reliability of their communication by ensuring that all components are able to trust one another.
By generating its own root CA, a Kubernetes cluster can be self-sufficient in managing the lifecycle of the certificates it uses for TLS. This includes generating, distributing, rotating, and revoking certificates as needed. This autonomy simplifies the setup and ongoing management of the cluster, especially in environments where integrating with an external CA might be challenging.
It's worth mentioning that this includes client certificates as well as server certificates, since client certificates aren't currently as well-known and ubiquitous as server certificates. So just as the API server has a server certificate that allows clients making requests to verify its identity, so clients will have a client certificate that allows the server to verify their identity.
So these certificate relationships maintain CIA (Confidentiality, Integrity, and Authentication) by:
- encrypting the data transmitted between the client and the server (Confidentiality)
- preventing tampering with the data transmitted between the client and the server (Integrity)
- verifying the identity of the server and the client (Authentication)
/apiserver
The Kubernetes API server is the central management entity of the cluster. The Kubernetes API allows users and internal and external processes and components to communicate and report and manage the state of the cluster. The API server accepts, validates, and executes REST operations, and is the only cluster component that interacts with etcd directly. etcd is the source of truth within the cluster, so it is essential that communication with the API server be secure.
/apiserver-kubelet-client
This is a client certificate for the API server, ensuring that it can authenticate itself to each kubelet and prove that it is a legitimate source of commands and requests.
/front-proxy-ca and front-proxy-client
The Front Proxy certificates seem to only be used in situations where kube-proxy is supporting an extension API server, and the API server/aggregator needs to connect to an extension API server respectively. This is beyond the scope of this project.
/etcd-ca
etcd can be configured to run "stacked" (deployed onto the control plane) or as an external cluster. For various reasons (security via isolation, access control, simplified rotation and management, etc), etcd is provided its own certificate authority.
/etcd-server
This is a server certificate for each etcd node, assuring the Kubernetes API server and etcd peers of its identity.
/etcd-peer
This is a client and server certificate, distributed to each etcd node, that enables them to communicate securely with one another.
/etcd-healthcheck-client
This is a client certificate that enables the caller to probe etcd. It permits broader access, in that multiple clients can use it, but the degree of that access is very restricted.
/apiserver-etcd-client
This is a client certificate permitting the API server to communicate with etcd.
/sa
This is a public and private key pair that is used for signing service account tokens.
Service accounts are used to provide an identity for processes that run in a Pod, permitting them to interact securely with the API server.
Service account tokens are JWTs (JSON Web Tokens). When a Pod accesses the Kubernetes API, it can present a service account token as a bearer token in the HTTP Authorization header. The API server then uses the public key to verify the signature on the token, and can then evaluate whether the claims are valid, etc.
kubeconfig
These phases write the necessary configuration files to secure and facilitate communication within the cluster and between administrator tools (like kubectl) and the cluster.
/admin
This is the kubeconfig file for the cluster administrator. It provides the admin user with full access to the cluster.
Now, per a change in 1.29, as Rory McCune explains, this admin credential is no longer a member of system:masters and instead has access granted via RBAC. This means that access can be revoked without having to manually rotate all of the cluster certificates.
/super-admin
This new credential also provides full access to the cluster, but via the system:masters group mechanism (read: irrevocable without rotating certificates). This also explains why, when watching my cluster spin up while using the admin.conf credentials, a time or two I saw access denied errors!
/kubelet
This credential is for use with the kubelet during cluster bootstrapping. It provides a baseline cluster-wide configuration for all kubelets in the cluster. It points to the client certificates that allow the kubelet to communicate with the API server so we can propagate cluster-level configuration to each kubelet.
/controller-manager
This credential is used by the Controller Manager. The Controller Manager is responsible for running controller processes, which watch the state of the cluster through the API server and make changes attempting to move the current state towards the desired state. This file contains credentials that allow the Controller Manager to communicate securely with the API server.
/scheduler
This credential is used by the Kubernetes Scheduler. The Scheduler is responsible for assigning work, in the form of Pods, to different nodes in the cluster. It makes these decisions based on resource availability, workload requirements, and other policies. This file contains the credentials needed for the Scheduler to interact with the API server.
etcd
This phase generates the static pod manifest file for local etcd.
Static pod manifests are files kept in (in our case) /etc/kubernetes/manifests; the kubelet observes this directory and will start/replace/delete pods accordingly. In the case of a "stacked" cluster, where we have critical control plane components like etcd and the API server running within pods, we need some method of creating and managing pods without those components. Static pod manifests provide this capability.
/local
This phase configures a local etcd instance to run on the same node as the other control plane components. This is what we'll be doing; later, when we join additional nodes to the control plane, the etcd cluster will expand.
For instance, the static pod manifest file for etcd on bettley, my first control plane node, has a spec.containers[0].command that looks like this:
....
  - command:
    - etcd
    - --advertise-client-urls=https://10.4.0.11:2379
    - --cert-file=/etc/kubernetes/pki/etcd/server.crt
    - --client-cert-auth=true
    - --data-dir=/var/lib/etcd
    - --experimental-initial-corrupt-check=true
    - --experimental-watch-progress-notify-interval=5s
    - --initial-advertise-peer-urls=https://10.4.0.11:2380
    - --initial-cluster=bettley=https://10.4.0.11:2380
    - --key-file=/etc/kubernetes/pki/etcd/server.key
    - --listen-client-urls=https://127.0.0.1:2379,https://10.4.0.11:2379
    - --listen-metrics-urls=http://127.0.0.1:2381
    - --listen-peer-urls=https://10.4.0.11:2380
    - --name=bettley
    - --peer-cert-file=/etc/kubernetes/pki/etcd/peer.crt
    - --peer-client-cert-auth=true
    - --peer-key-file=/etc/kubernetes/pki/etcd/peer.key
    - --peer-trusted-ca-file=/etc/kubernetes/pki/etcd/ca.crt
    - --snapshot-count=10000
    - --trusted-ca-file=/etc/kubernetes/pki/etcd/ca.crt
....
whereas on fenn, the second control plane node, the corresponding static pod manifest file looks like this:
  - command:
    - etcd
    - --advertise-client-urls=https://10.4.0.15:2379
    - --cert-file=/etc/kubernetes/pki/etcd/server.crt
    - --client-cert-auth=true
    - --data-dir=/var/lib/etcd
    - --experimental-initial-corrupt-check=true
    - --experimental-watch-progress-notify-interval=5s
    - --initial-advertise-peer-urls=https://10.4.0.15:2380
    - --initial-cluster=fenn=https://10.4.0.15:2380,gardener=https://10.4.0.16:2380,bettley=https://10.4.0.11:2380
    - --initial-cluster-state=existing
    - --key-file=/etc/kubernetes/pki/etcd/server.key
    - --listen-client-urls=https://127.0.0.1:2379,https://10.4.0.15:2379
    - --listen-metrics-urls=http://127.0.0.1:2381
    - --listen-peer-urls=https://10.4.0.15:2380
    - --name=fenn
    - --peer-cert-file=/etc/kubernetes/pki/etcd/peer.crt
    - --peer-client-cert-auth=true
    - --peer-key-file=/etc/kubernetes/pki/etcd/peer.key
    - --peer-trusted-ca-file=/etc/kubernetes/pki/etcd/ca.crt
    - --snapshot-count=10000
    - --trusted-ca-file=/etc/kubernetes/pki/etcd/ca.crt
and correspondingly, we can see three pods:
$ kubectl -n kube-system get pods
NAME                                       READY   STATUS    RESTARTS   AGE
etcd-bettley                               1/1     Running   19         3h23m
etcd-fenn                                  1/1     Running   0          3h22m
etcd-gardener                              1/1     Running   0          3h23m
control-plane
This phase generates the static pod manifest files for the other (non-etcd) control plane components.
/apiserver
This generates the static pod manifest file for the API server, which we've already discussed quite a bit.
/controller-manager
This generates the static pod manifest file for the controller manager. The controller manager embeds the core control loops shipped with Kubernetes. A controller is a loop that watches the shared state of the cluster through the API server and makes changes attempting to move the current state towards the desired state. Examples of controllers that are part of the Controller Manager include the Replication Controller, Endpoints Controller, Namespace Controller, and ServiceAccounts Controller.
/scheduler
This phase generates the static pod manifest file for the scheduler. The scheduler is responsible for allocating pods to nodes in the cluster based on various scheduling principles, including resource availability, constraints, affinities, etc.
kubelet-start
Throughout this process, the kubelet has been in a crash loop because it hasn't had a valid configuration.
This phase generates a config which (at least on my system) is stored at /var/lib/kubelet/config.yaml, as well as a "bootstrap" configuration that allows the kubelet to connect to the control plane (and retrieve credentials for longterm use).
Then the kubelet is restarted and will bootstrap with the control plane.
upload-certs
This phase enables the secure distribution of the certificates we created above, in the certs phases.
Some certificates need to be shared across the cluster (or at least across the control plane) for secure communication. This includes the certificates for the API server, etcd, the front proxy, etc.
kubeadm generates an encryption key that is used to encrypt the certificates, so they're not actually exposed in plain text at any point. Then the encrypted certificates are uploaded to etcd, a distributed key-value store that Kubernetes uses for persisting cluster state. To facilitate future joins of control plane nodes without having to manually distribute certificates, these encrypted certificates are stored in a specific kubeadm-certs secret.
The encryption key is required to decrypt the certificates for use by joining nodes. This key is not uploaded to the cluster for security reasons. Instead, it must be manually shared with any future control plane nodes that join the cluster. kubeadm outputs this key upon completion of the upload-certs phase, and it's the administrator's responsibility to securely transfer this key when adding new control plane nodes.
This process allows for the secure addition of new control plane nodes to the cluster by ensuring they have access to the necessary certificates to communicate securely with the rest of the cluster. Without this phase, administrators would have to manually copy certificates to each new node, which can be error-prone and insecure.
By automating the distribution of these certificates and utilizing encryption for their transfer, kubeadm significantly simplifies the process of scaling the cluster's control plane, while maintaining high standards of security.
mark-control-plane
In this phase, kubeadm applies a specific label to control plane nodes: node-role.kubernetes.io/control-plane=""; this marks the node as part of the control plane. Additionally, the node receives a taint, node-role.kubernetes.io/control-plane=:NoSchedule, which will prevent normal workloads from being scheduled on it.
As noted previously, I see no reason to remove this taint, although I'll probably enable some tolerations for certain workloads (monitoring, etc).
bootstrap-token
This phase creates bootstrap tokens, which are used to authenticate new nodes joining the cluster. This is how we are able to easily scale the cluster dynamically without copying multiple certificates and private keys around.
The "TLS bootstrap" process allows a kubelet to automatically request a certificate from the Kubernetes API server. This certificate is then used for secure communication within the cluster. The process involves the use of a bootstrap token and a Certificate Signing Request (CSR) that the kubelet generates. Once approved, the kubelet receives a certificate and key that it uses for authenticated communication with the API server.
Bootstrap tokens are a simple bearer token. This token is composed of two parts: an ID and a secret, formatted as <id>.<secret>. The ID and secret are randomly generated strings that authenticate the joining nodes to the cluster.
The generated token is configured with specific permissions using RBAC policies. These permissions typically allow the token to create a certificate signing request (CSR) that the Kubernetes control plane can then approve, granting the joining node the necessary certificates to communicate securely within the cluster.
By default, bootstrap tokens are set to expire after a certain period (24 hours by default), ensuring that tokens cannot be reused indefinitely for joining new nodes to the cluster. This behavior enhances the security posture of the cluster by limiting the window during which a token is valid.
Once generated and configured, the bootstrap token is stored as a secret in the kube-system namespace.
kubelet-finalize
This phase ensures that the kubelet is fully configured with the necessary settings to securely and effectively participate in the cluster. It involves applying any final kubelet configurations that might depend on the completion of the TLS bootstrap process.
addon
This phase sets up essential add-ons required for the cluster to meet the Kubernetes Conformance Tests.
/coredns
CoreDNS provides DNS services for the internal cluster network, allowing pods to find each other by name and services to load-balance across a set of pods.
/kube-proxy
kube-proxy is responsible for managing network communication inside the cluster, implementing part of the Kubernetes Service concept by maintaining network rules on nodes. These rules allow network communication to pods from network sessions inside or outside the cluster.
kube-proxy ensures that the networking aspect of Kubernetes services is correctly handled, allowing for the routing of traffic to the appropriate destinations. It operates in the user space, and it can also run in iptables mode, where it manipulates rules to allow network traffic. This allows services to be exposed to the external network, load balances traffic to pods across the multiple instances, etc.
show-join-command
This phase simplifies the process of expanding a Kubernetes cluster by generating bootstrap tokens and providing the necessary command to join additional nodes, whether they are worker nodes or additional control plane nodes.
In the next section, we'll actually bootstrap the cluster.
Bootstrapping the First Control Plane Node
With a solid idea of what it is that kubeadm init actually does, we can return to our command:
kubeadm init \
  --control-plane-endpoint="10.4.0.10:6443" \
  --kubernetes-version="stable-1.29" \
  --service-cidr="172.16.0.0/20" \
  --pod-network-cidr="192.168.0.0/16" \
  --cert-dir="/etc/kubernetes/pki" \
  --cri-socket="unix:///var/run/containerd/containerd.sock" \
  --upload-certs
It's really pleasantly concise, given how much is going on under the hood.
The Ansible tasks also symlinks the /etc/kubernetes/admin.conf file to ~/.kube/config (so we can use kubectl without having to specify the config file).
Then it sets up my preferred Container Network Interface addon, Calico. I have in the past sometimes used Flannel, but Flannel doesn't support NetworkPolicy resources as it is a Layer 3 networking solution, whereas Calico operates at Layer 3 and Layer 4, which allows it fine-grained control over traffic based on ports, protocol types, sources and destinations, etc.
I want to play with NetworkPolicy resources, so Calico it is.
The next couple of steps create bootstrap tokens so we can join the cluster.
Joining the Rest of the Control Plane
The next phase of bootstrapping is to admit the rest of the control plane nodes to the control plane.
First, we create a JoinConfiguration manifest, which should look something like this (in Jinja2):
apiVersion: kubeadm.k8s.io/v1beta3
kind: JoinConfiguration
discovery:
  bootstrapToken:
    apiServerEndpoint: {{ load_balancer.ipv4_address }}:6443
    token: {{ kubeadm_token }}
    unsafeSkipCAVerification: true
  timeout: 5m0s
  tlsBootstrapToken: {{ kubeadm_token }}
controlPlane:
  localAPIEndpoint:
    advertiseAddress: {{ ipv4_address }}
    bindPort: 6443
  certificateKey: {{ k8s_certificate_key }}
nodeRegistration:
  name: {{ inventory_hostname }}
  criSocket: {{ k8s_cri_socket }}
{% if inventory_hostname in control_plane.rest.hostnames %}
  taints:
  - effect: NoSchedule
    key: node-role.kubernetes.io/control-plane
{% else %}
  taints: []
{% endif %}
I haven't bothered to substitute the values; none of them should be mysterious at this point.
After that, a simple kubeadm join --config /etc/kubernetes/kubeadm-controlplane.yaml on each node is sufficient to complete the control plane.
Admitting the Worker Nodes
Admitting the worker nodes to the cluster is simple; we just have the first control plane node create a token and print the join command (kubeadm token create --print-join-command) for each worker node, then execute it from that worker node.
And voilà! We have a functioning cluster.
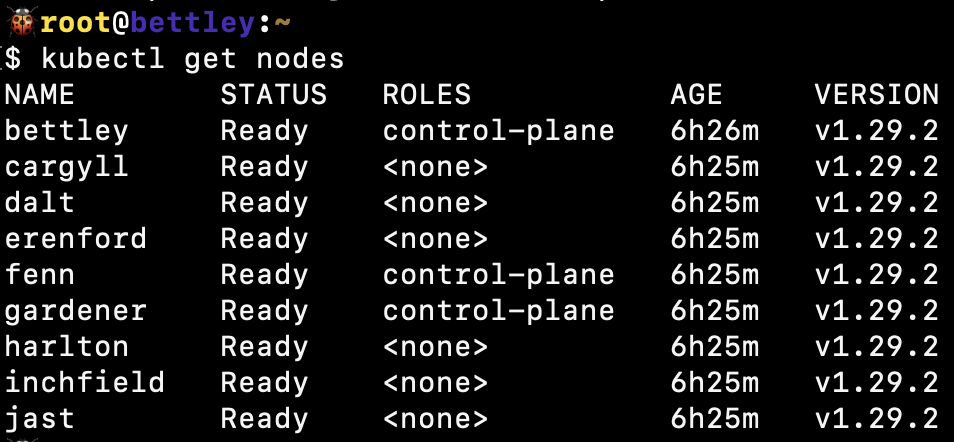
We can also see that the cluster is functioning well from HAProxy's perspective:
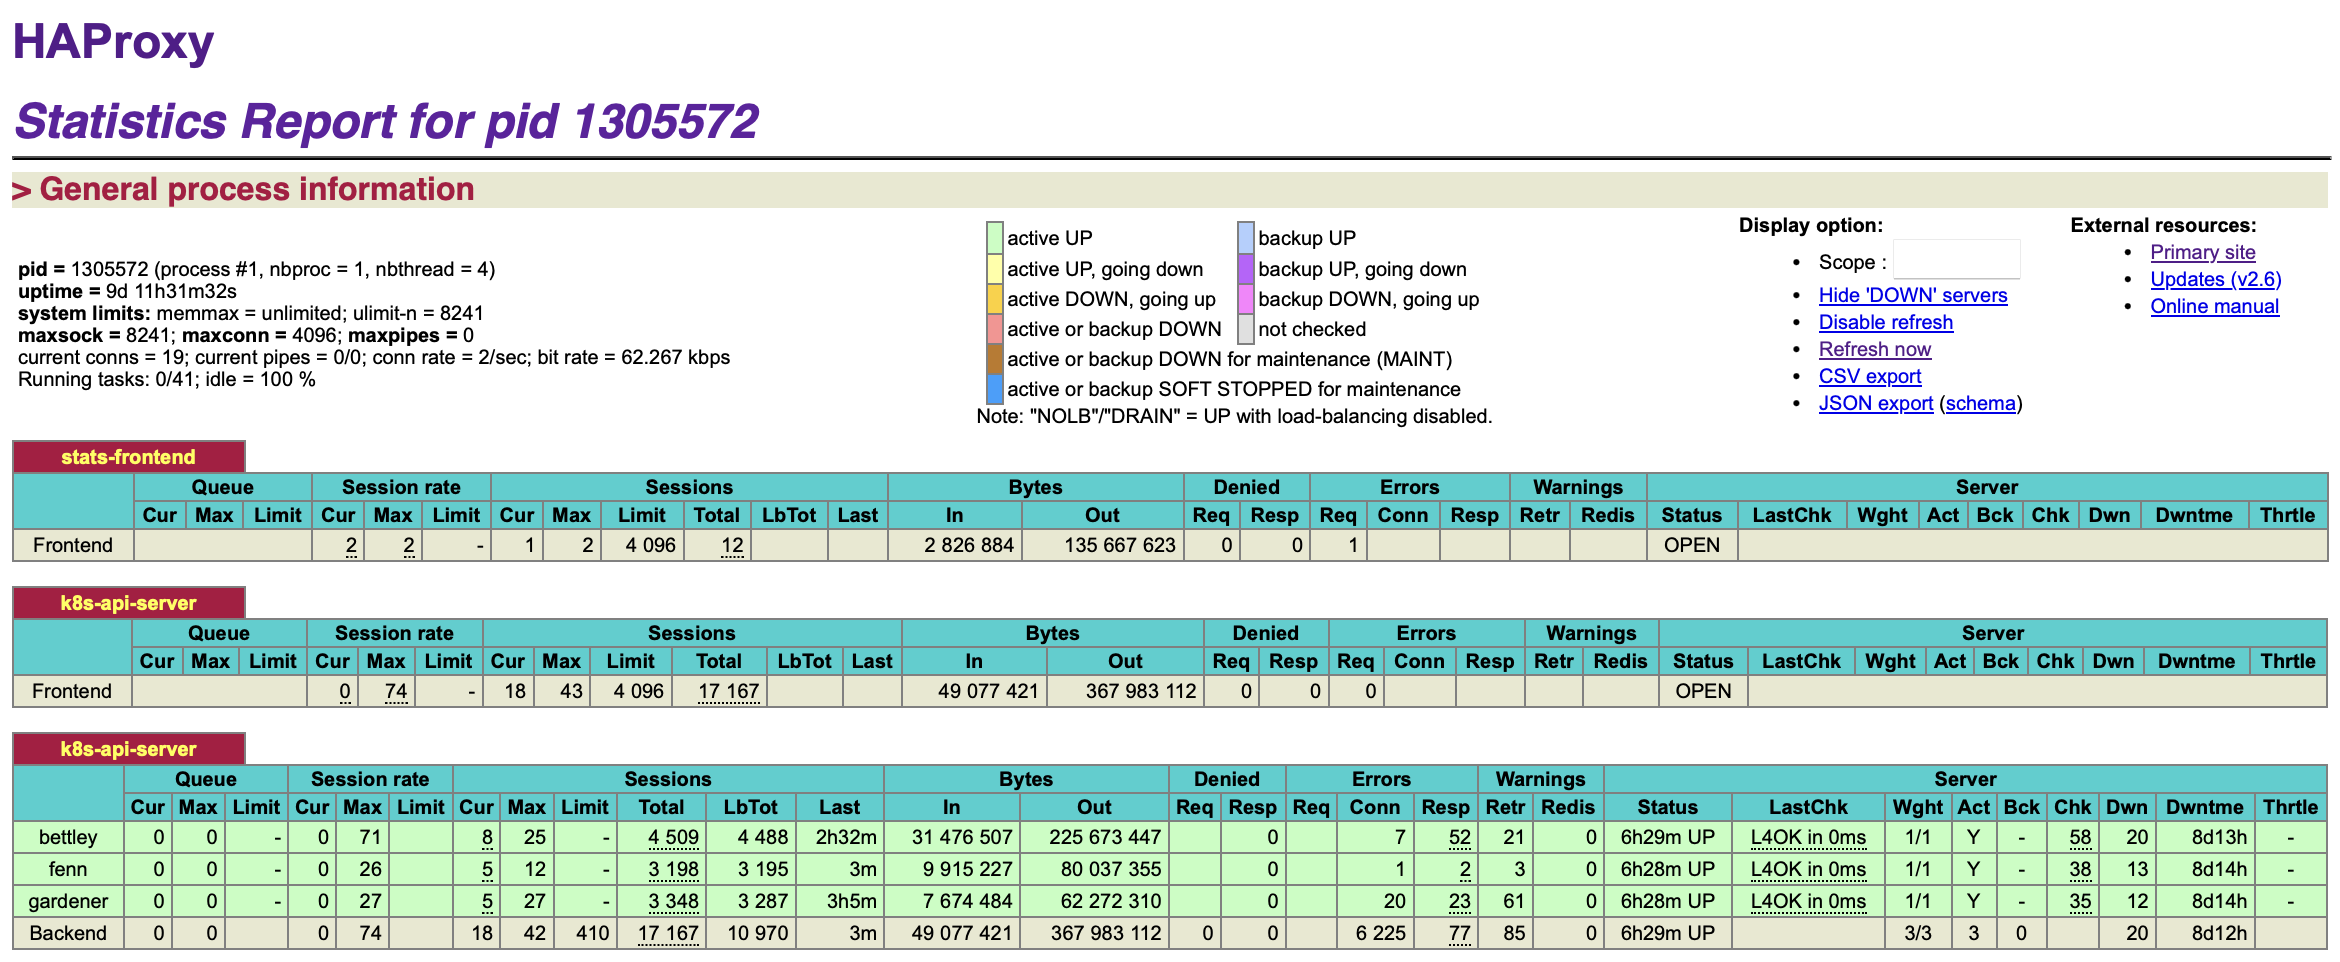
As a reminder, this is all persisted in the Ansible tasks.
Where Do We Go From Here?
We have a functioning cluster now, which is to say that I've spent many hours of my life that I'm not going to get back just doing the same thing that the official documentation manages to convey in just a few lines.
Or that Jeff Geerling's geerlingguy.kubernetes has already managed to do.
And it's not a tenth of a percent as much as Kubespray can do.
Not much to be proud of, but again, this is a personal learning journey. I'm just trying to build a cluster thoughtfully, limiting the black boxes and the magic as much as practical.
In the following sections, I'll add more functionality.
Installing Helm
I have a lot of ambitions for this cluster, but after some deliberation, the thing I most want to do right now is deploy something to Kubernetes.
So I'll be starting out by installing Argo CD, and I'll do that... soon. In the next chapter. I decided to install Argo CD via Helm, since I expect that Helm will be useful in other situations as well, e.g. trying out applications before I commit (no pun intended) to bringing them into GitOps.
So I created a playbook and role to cover installing Helm.
Fortunately, this is fairly simple to install and trivial to configure, which is not something I can say for Argo CD 🙂
Installing Argo CD
GitOps is a methodology based around treating IaC stored in Git as a source of truth for the desired state of the infrastructure. Put simply, whatever you push to main becomes the desired state and your IaC systems, whether they be Terraform, Ansible, etc, will be invoked to bring the actual state into alignment.
Argo CD is a popular system for implementing GitOps with Kubernetes. It can observe a Git repository for changes and react to those changes accordingly, creating/destroying/replacing resources as needed within the cluster.
Argo CD is a large, complicated application in its own right; its Helm chart is thousands of lines long. I'm not trying to learn it all right now, and fortunately, I have a fairly simple structure in mind.
I'll install Argo CD via a new Ansible playbook and role that use Helm, which we set up in the last section.
None of this is particularly complex, but I'll document some of my values overrides here:
# I've seen a mix of `argocd` and `argo-cd` scattered around. I preferred
# `argocd`, but I will shift to `argo-cd` where possible to improve
# consistency.
#
# EDIT: The `argocd` CLI tool appears to be broken and does not allow me to
# override the names of certain components when port forwarding.
# See https://github.com/argoproj/argo-cd/issues/16266 for details.
# As a result, I've gone through and reverted my changes to standardize as much
# as possible on `argocd`. FML.
nameOverride: 'argocd'
global:
  # This evaluates to `argocd.goldentooth.hellholt.net`.
  domain: "{{ argocd_domain }}"
  # Add Prometheus scrape annotations to all metrics services. This can
  # be used as an alternative to the ServiceMonitors.
  addPrometheusAnnotations: true
  # Default network policy rules used by all components.
  networkPolicy:
    # Create NetworkPolicy objects for all components; this is currently false
    # but I think I'd like to create these later.
    create: false
    # Default deny all ingress traffic; I want to improve security, so I hope
    # to enable this later.
    defaultDenyIngress: false
configs:
  secret:
    createSecret: true
    # Specify a password. I store an "easy" password, which is in my muscle
    # memory, so I'll use that for right now.
    argocdServerAdminPassword: "{{ vault.easy_password | password_hash('bcrypt') }}"
  # Refer to the repositories that host our applications.
  repositories:
    # This is the main (and likely only) one.
    gitops:
      type: 'git'
      name: 'gitops'
      # This turns out to be https://github.com/goldentooth/gitops.git
      url: "{{ argocd_app_repo_url }}"

redis-ha:
  # Enable Redis high availability.
  enabled: true

controller:
  # The HA configuration keeps this at one, and I don't see a reason to change.
  replicas: 1

server:
  # Enable
  autoscaling:
    enabled: true
    # This immediately scaled up to 3 replicas.
    minReplicas: 2
  # I'll make this more secure _soon_.
  extraArgs:
    - '--insecure'
  # I don't have load balancing set up yet.
  service:
    type: 'ClusterIP'

repoServer:
  autoscaling:
    enabled: true
    minReplicas: 2

applicationSet:
  replicas: 2
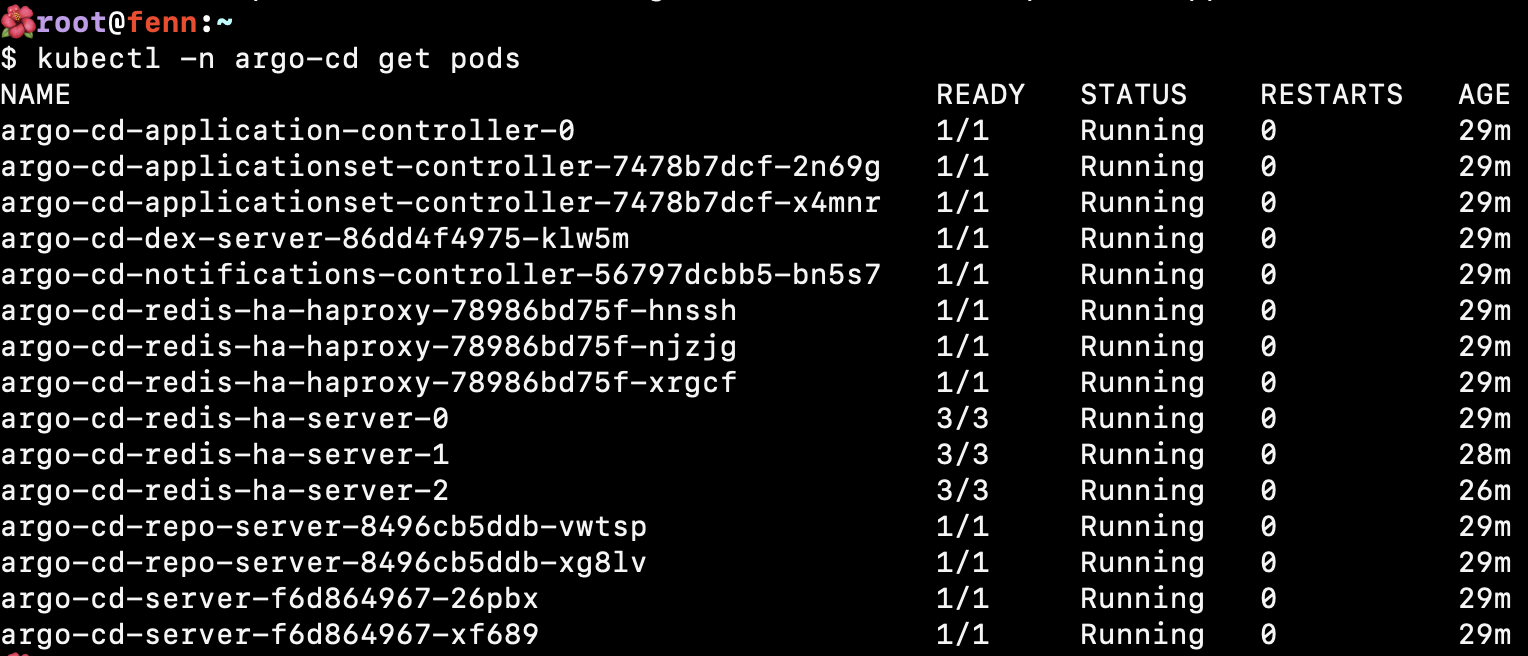
After running kubectl -n argocd port-forward service/argocd-server 8081:443 --address 0.0.0.0 on one of my control plane nodes, I'm able to view the web interface, log in, but there's nothing interesting.
I'll try to improve this situation shortly.
The "Incubator" GitOps Application
Previously, we discussed GitOps and how Argo CD provides a platform for implementing GitOps for Kubernetes.
As mentioned, the general idea is to have some Git repository somewhere that defines an application. We create a corresponding resource in Argo CD to represent that application, and Argo CD will henceforth watch the repository and make changes to the running application as needed.
What does the repository actually include? Well, it might be a Helm chart, or a kustomization, or raw manifests, etc. Pretty much anything that could be done in Kubernetes.
Of course, setting this up involves some manual work; you need to actually create the application within Argo CD and, if you want it to hang around, you need to presumably commit that resource to some version control system somewhere. We of course want to be careful who has access to that repository, though, and we might not want engineers to have access to Argo CD itself. So suddenly there's a rather uncomfortable amount of work and coupling in all of this.
A common pattern in Argo CD is the "app-of-apps" pattern. This is simply an Argo CD application pointing to a repository that contains other Argo CD applications. Thus you can have a single application created for you by the principal platform engineer, and you can turn it into fifty or a hundred finely grained pieces of infrastructure that said principal engineer doesn't have to know about 🙂
(If they haven't configured the security settings carefully, it can all just be your little secret 😉)
Given that we're operating in a lab environment, we can use the "app-of-apps" approach for the Incubator, which is where we can try out new configurations. We can give it fairly unrestricted access while we work on getting things to deploy correctly, and then lock things down as we zero in on a stable configuration.
A (relatively) new construct in Argo CD is the ApplicationSet construct, which seeks to more clearly define how applications are created and fix the problems with the "app-of-apps" approach. That's the approach we will take in this cluster for mature applications.
But meanwhile, we'll create an AppProject manifest for the Incubator:
---
apiVersion: 'argoproj.io/v1alpha1'
kind: 'AppProject'
metadata:
  name: 'incubator'
  # Argo CD resources need to deploy into the Argo CD namespace.
  namespace: 'argocd'
  finalizers:
    - 'resources-finalizer.argocd.argoproj.io'
spec:
  description: 'GoldenTooth incubator project'
  # Allow manifests to deploy from any Git repository.
  # This is an acceptable security risk because this is a lab environment
  # and I am the only user.
  sourceRepos:
    - '*'
  destinations:
    # Prevent any resources from deploying into the kube-system namespace.
    - namespace: '!kube-system'
      server: '*'
    # Allow resources to deploy into any other namespace.
    - namespace: '*'
      server: '*'
  clusterResourceWhitelist:
    # Allow any cluster resources to deploy.
    - group: '*'
      kind: '*'
As mentioned before, this is very permissive. It only slightly differs from the default project by preventing resources from deploying into the kube-system namespace.
We'll also create an Application manifest:
apiVersion: 'argoproj.io/v1alpha1'
kind: 'Application'
metadata:
  name: 'incubator'
  namespace: 'argocd'
  labels:
    name: 'incubator'
    managed-by: 'argocd'
spec:
  project: 'incubator'
  source:
    repoURL: "https://github.com/goldentooth/incubator.git"
    path: './'
    targetRevision: 'HEAD'
  destination:
    server: 'https://kubernetes.default.svc'
  syncPolicy:
    automated:
      prune: true
      selfHeal: true
    syncOptions:
      - Validate=true
      - CreateNamespace=true
      - PrunePropagationPolicy=foreground
      - PruneLast=true
      - RespectIgnoreDifferences=true
      - ApplyOutOfSyncOnly=true
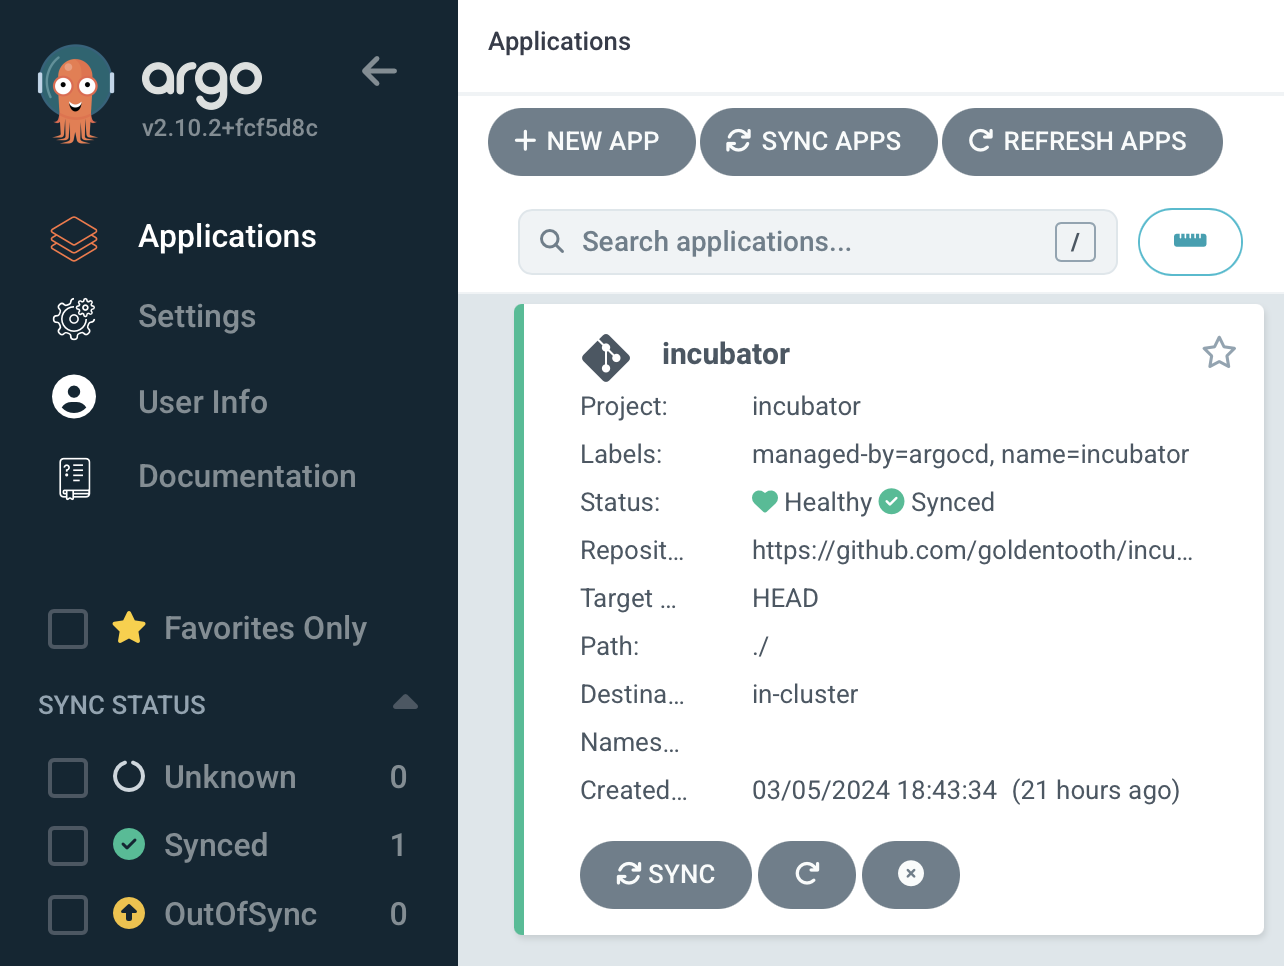
That's sufficient to get it to pop up in the Applications view in Argo CD.
Prometheus Node Exporter
Sure, I could just jump straight into kube-prometheus, but where's the fun (and, more importantly, the learning) in that?
I'm going to try to build a system from the ground up, tweaking each component as I go.
Prometheus Node Exporter seems like a reasonable place to begin, as it will give me per-node statistics that I can look at immediately. Or almost immediately.
The first order of business is to modify our incubator repository to refer to the Prometheus Node Exporter Helm chart.
By adding the following in the incubator repo:
# templates/prometheus_node_exporter.yaml
apiVersion: v1
kind: Namespace
metadata:
  name: prometheus-node-exporter
---
apiVersion: argoproj.io/v1alpha1
kind: Application
metadata:
  name: prometheus-node-exporter
  namespace: argocd
  finalizers:
    - resources-finalizer.argocd.argoproj.io
spec:
  destination:
    namespace: prometheus-node-exporter
    server: 'https://kubernetes.default.svc'
  project: incubator
  source:
    repoURL: https://prometheus-community.github.io/helm-charts
    chart: prometheus-node-exporter
    targetRevision: 4.31.0
    helm:
      releaseName: prometheus-node-exporter
We'll soon see the resources created:
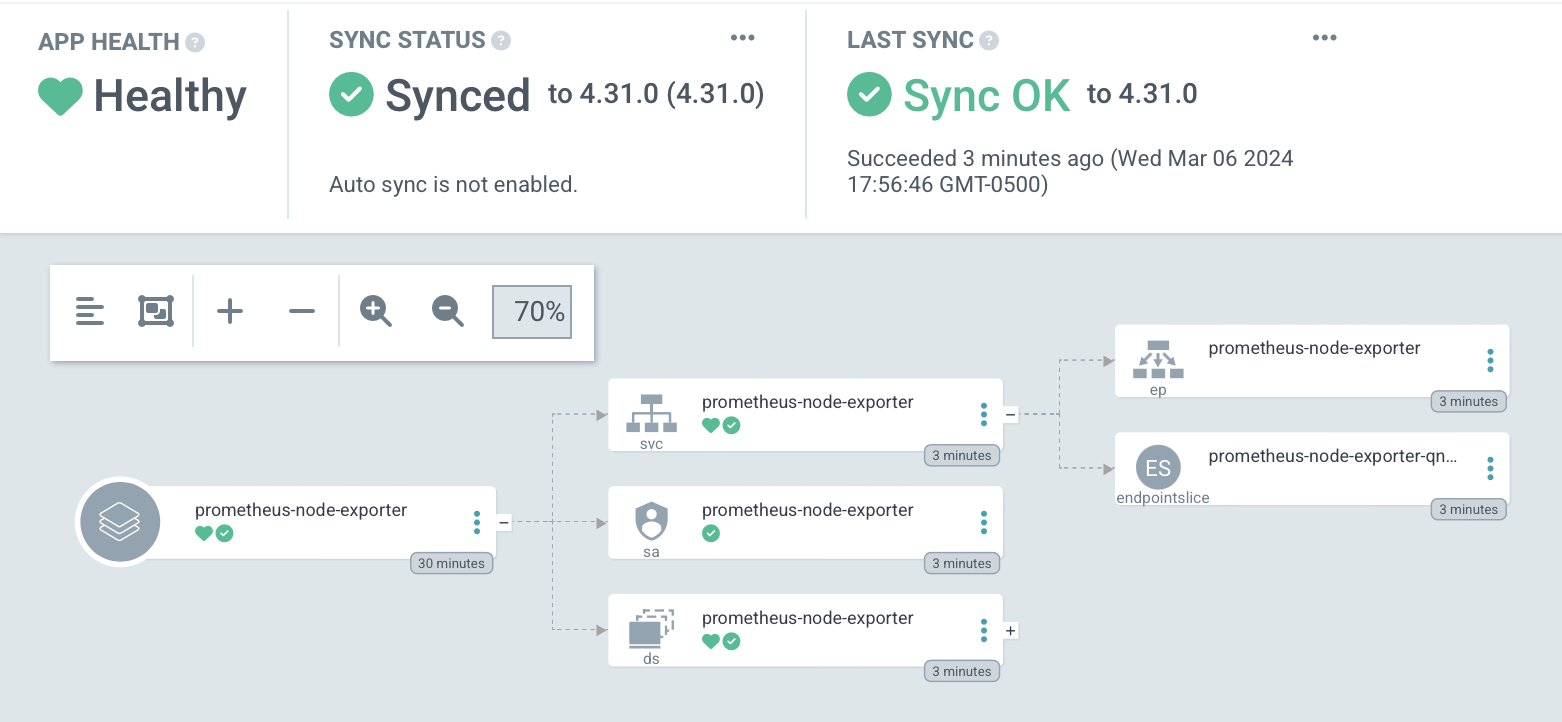
And we can curl a metric butt-ton of information:
$ curl localhost:9100/metrics
# HELP go_gc_duration_seconds A summary of the pause duration of garbage collection cycles.
# TYPE go_gc_duration_seconds summary
go_gc_duration_seconds{quantile="0"} 0
go_gc_duration_seconds{quantile="0.25"} 0
go_gc_duration_seconds{quantile="0.5"} 0
go_gc_duration_seconds{quantile="0.75"} 0
go_gc_duration_seconds{quantile="1"} 0
go_gc_duration_seconds_sum 0
go_gc_duration_seconds_count 0
# HELP go_goroutines Number of goroutines that currently exist.
# TYPE go_goroutines gauge
go_goroutines 7
# HELP go_info Information about the Go environment.
# TYPE go_info gauge
go_info{version="go1.21.4"} 1
# HELP go_memstats_alloc_bytes Number of bytes allocated and still in use.
# TYPE go_memstats_alloc_bytes gauge
go_memstats_alloc_bytes 829976
# HELP go_memstats_alloc_bytes_total Total number of bytes allocated, even if freed.
# TYPE go_memstats_alloc_bytes_total counter
go_memstats_alloc_bytes_total 829976
# HELP go_memstats_buck_hash_sys_bytes Number of bytes used by the profiling bucket hash table.
# TYPE go_memstats_buck_hash_sys_bytes gauge
go_memstats_buck_hash_sys_bytes 1.445756e+06
# HELP go_memstats_frees_total Total number of frees.
# TYPE go_memstats_frees_total counter
go_memstats_frees_total 704
# HELP go_memstats_gc_sys_bytes Number of bytes used for garbage collection system metadata.
# TYPE go_memstats_gc_sys_bytes gauge
go_memstats_gc_sys_bytes 2.909376e+06
# HELP go_memstats_heap_alloc_bytes Number of heap bytes allocated and still in use.
# TYPE go_memstats_heap_alloc_bytes gauge
go_memstats_heap_alloc_bytes 829976
# HELP go_memstats_heap_idle_bytes Number of heap bytes waiting to be used.
# TYPE go_memstats_heap_idle_bytes gauge
go_memstats_heap_idle_bytes 1.458176e+06
# HELP go_memstats_heap_inuse_bytes Number of heap bytes that are in use.
# TYPE go_memstats_heap_inuse_bytes gauge
go_memstats_heap_inuse_bytes 2.310144e+06
# HELP go_memstats_heap_objects Number of allocated objects.
# TYPE go_memstats_heap_objects gauge
go_memstats_heap_objects 8628
# HELP go_memstats_heap_released_bytes Number of heap bytes released to OS.
# TYPE go_memstats_heap_released_bytes gauge
go_memstats_heap_released_bytes 1.458176e+06
# HELP go_memstats_heap_sys_bytes Number of heap bytes obtained from system.
# TYPE go_memstats_heap_sys_bytes gauge
go_memstats_heap_sys_bytes 3.76832e+06
# HELP go_memstats_last_gc_time_seconds Number of seconds since 1970 of last garbage collection.
# TYPE go_memstats_last_gc_time_seconds gauge
go_memstats_last_gc_time_seconds 0
# HELP go_memstats_lookups_total Total number of pointer lookups.
# TYPE go_memstats_lookups_total counter
go_memstats_lookups_total 0
# HELP go_memstats_mallocs_total Total number of mallocs.
# TYPE go_memstats_mallocs_total counter
go_memstats_mallocs_total 9332
# HELP go_memstats_mcache_inuse_bytes Number of bytes in use by mcache structures.
# TYPE go_memstats_mcache_inuse_bytes gauge
go_memstats_mcache_inuse_bytes 1200
# HELP go_memstats_mcache_sys_bytes Number of bytes used for mcache structures obtained from system.
# TYPE go_memstats_mcache_sys_bytes gauge
go_memstats_mcache_sys_bytes 15600
# HELP go_memstats_mspan_inuse_bytes Number of bytes in use by mspan structures.
# TYPE go_memstats_mspan_inuse_bytes gauge
go_memstats_mspan_inuse_bytes 37968
# HELP go_memstats_mspan_sys_bytes Number of bytes used for mspan structures obtained from system.
# TYPE go_memstats_mspan_sys_bytes gauge
go_memstats_mspan_sys_bytes 48888
# HELP go_memstats_next_gc_bytes Number of heap bytes when next garbage collection will take place.
# TYPE go_memstats_next_gc_bytes gauge
go_memstats_next_gc_bytes 4.194304e+06
# HELP go_memstats_other_sys_bytes Number of bytes used for other system allocations.
# TYPE go_memstats_other_sys_bytes gauge
go_memstats_other_sys_bytes 795876
# HELP go_memstats_stack_inuse_bytes Number of bytes in use by the stack allocator.
# TYPE go_memstats_stack_inuse_bytes gauge
go_memstats_stack_inuse_bytes 425984
# HELP go_memstats_stack_sys_bytes Number of bytes obtained from system for stack allocator.
# TYPE go_memstats_stack_sys_bytes gauge
go_memstats_stack_sys_bytes 425984
# HELP go_memstats_sys_bytes Number of bytes obtained from system.
# TYPE go_memstats_sys_bytes gauge
go_memstats_sys_bytes 9.4098e+06
# HELP go_threads Number of OS threads created.
# TYPE go_threads gauge
go_threads 6
# HELP node_boot_time_seconds Node boot time, in unixtime.
# TYPE node_boot_time_seconds gauge
node_boot_time_seconds 1.706835386e+09
# HELP node_context_switches_total Total number of context switches.
# TYPE node_context_switches_total counter
node_context_switches_total 1.8612307682e+10
# HELP node_cooling_device_cur_state Current throttle state of the cooling device
# TYPE node_cooling_device_cur_state gauge
node_cooling_device_cur_state{name="0",type="gpio-fan"} 1
# HELP node_cooling_device_max_state Maximum throttle state of the cooling device
# TYPE node_cooling_device_max_state gauge
node_cooling_device_max_state{name="0",type="gpio-fan"} 1
# HELP node_cpu_frequency_max_hertz Maximum CPU thread frequency in hertz.
# TYPE node_cpu_frequency_max_hertz gauge
node_cpu_frequency_max_hertz{cpu="0"} 2e+09
node_cpu_frequency_max_hertz{cpu="1"} 2e+09
node_cpu_frequency_max_hertz{cpu="2"} 2e+09
node_cpu_frequency_max_hertz{cpu="3"} 2e+09
# HELP node_cpu_frequency_min_hertz Minimum CPU thread frequency in hertz.
# TYPE node_cpu_frequency_min_hertz gauge
node_cpu_frequency_min_hertz{cpu="0"} 6e+08
node_cpu_frequency_min_hertz{cpu="1"} 6e+08
node_cpu_frequency_min_hertz{cpu="2"} 6e+08
node_cpu_frequency_min_hertz{cpu="3"} 6e+08
# HELP node_cpu_guest_seconds_total Seconds the CPUs spent in guests (VMs) for each mode.
# TYPE node_cpu_guest_seconds_total counter
node_cpu_guest_seconds_total{cpu="0",mode="nice"} 0
node_cpu_guest_seconds_total{cpu="0",mode="user"} 0
node_cpu_guest_seconds_total{cpu="1",mode="nice"} 0
node_cpu_guest_seconds_total{cpu="1",mode="user"} 0
node_cpu_guest_seconds_total{cpu="2",mode="nice"} 0
node_cpu_guest_seconds_total{cpu="2",mode="user"} 0
node_cpu_guest_seconds_total{cpu="3",mode="nice"} 0
node_cpu_guest_seconds_total{cpu="3",mode="user"} 0
# HELP node_cpu_scaling_frequency_hertz Current scaled CPU thread frequency in hertz.
# TYPE node_cpu_scaling_frequency_hertz gauge
node_cpu_scaling_frequency_hertz{cpu="0"} 2e+09
node_cpu_scaling_frequency_hertz{cpu="1"} 2e+09
node_cpu_scaling_frequency_hertz{cpu="2"} 2e+09
node_cpu_scaling_frequency_hertz{cpu="3"} 7e+08
# HELP node_cpu_scaling_frequency_max_hertz Maximum scaled CPU thread frequency in hertz.
# TYPE node_cpu_scaling_frequency_max_hertz gauge
node_cpu_scaling_frequency_max_hertz{cpu="0"} 2e+09
node_cpu_scaling_frequency_max_hertz{cpu="1"} 2e+09
node_cpu_scaling_frequency_max_hertz{cpu="2"} 2e+09
node_cpu_scaling_frequency_max_hertz{cpu="3"} 2e+09
# HELP node_cpu_scaling_frequency_min_hertz Minimum scaled CPU thread frequency in hertz.
# TYPE node_cpu_scaling_frequency_min_hertz gauge
node_cpu_scaling_frequency_min_hertz{cpu="0"} 6e+08
node_cpu_scaling_frequency_min_hertz{cpu="1"} 6e+08
node_cpu_scaling_frequency_min_hertz{cpu="2"} 6e+08
node_cpu_scaling_frequency_min_hertz{cpu="3"} 6e+08
# HELP node_cpu_scaling_governor Current enabled CPU frequency governor.
# TYPE node_cpu_scaling_governor gauge
node_cpu_scaling_governor{cpu="0",governor="conservative"} 0
node_cpu_scaling_governor{cpu="0",governor="ondemand"} 1
node_cpu_scaling_governor{cpu="0",governor="performance"} 0
node_cpu_scaling_governor{cpu="0",governor="powersave"} 0
node_cpu_scaling_governor{cpu="0",governor="schedutil"} 0
node_cpu_scaling_governor{cpu="0",governor="userspace"} 0
node_cpu_scaling_governor{cpu="1",governor="conservative"} 0
node_cpu_scaling_governor{cpu="1",governor="ondemand"} 1
node_cpu_scaling_governor{cpu="1",governor="performance"} 0
node_cpu_scaling_governor{cpu="1",governor="powersave"} 0
node_cpu_scaling_governor{cpu="1",governor="schedutil"} 0
node_cpu_scaling_governor{cpu="1",governor="userspace"} 0
node_cpu_scaling_governor{cpu="2",governor="conservative"} 0
node_cpu_scaling_governor{cpu="2",governor="ondemand"} 1
node_cpu_scaling_governor{cpu="2",governor="performance"} 0
node_cpu_scaling_governor{cpu="2",governor="powersave"} 0
node_cpu_scaling_governor{cpu="2",governor="schedutil"} 0
node_cpu_scaling_governor{cpu="2",governor="userspace"} 0
node_cpu_scaling_governor{cpu="3",governor="conservative"} 0
node_cpu_scaling_governor{cpu="3",governor="ondemand"} 1
node_cpu_scaling_governor{cpu="3",governor="performance"} 0
node_cpu_scaling_governor{cpu="3",governor="powersave"} 0
node_cpu_scaling_governor{cpu="3",governor="schedutil"} 0
node_cpu_scaling_governor{cpu="3",governor="userspace"} 0
# HELP node_cpu_seconds_total Seconds the CPUs spent in each mode.
# TYPE node_cpu_seconds_total counter
node_cpu_seconds_total{cpu="0",mode="idle"} 2.68818165e+06
node_cpu_seconds_total{cpu="0",mode="iowait"} 8376.2
node_cpu_seconds_total{cpu="0",mode="irq"} 0
node_cpu_seconds_total{cpu="0",mode="nice"} 64.64
node_cpu_seconds_total{cpu="0",mode="softirq"} 17095.42
node_cpu_seconds_total{cpu="0",mode="steal"} 0
node_cpu_seconds_total{cpu="0",mode="system"} 69354.3
node_cpu_seconds_total{cpu="0",mode="user"} 100985.22
node_cpu_seconds_total{cpu="1",mode="idle"} 2.70092994e+06
node_cpu_seconds_total{cpu="1",mode="iowait"} 10578.32
node_cpu_seconds_total{cpu="1",mode="irq"} 0
node_cpu_seconds_total{cpu="1",mode="nice"} 61.07
node_cpu_seconds_total{cpu="1",mode="softirq"} 3442.94
node_cpu_seconds_total{cpu="1",mode="steal"} 0
node_cpu_seconds_total{cpu="1",mode="system"} 72718.57
node_cpu_seconds_total{cpu="1",mode="user"} 112849.28
node_cpu_seconds_total{cpu="2",mode="idle"} 2.70036651e+06
node_cpu_seconds_total{cpu="2",mode="iowait"} 10596.56
node_cpu_seconds_total{cpu="2",mode="irq"} 0
node_cpu_seconds_total{cpu="2",mode="nice"} 44.05
node_cpu_seconds_total{cpu="2",mode="softirq"} 3462.77
node_cpu_seconds_total{cpu="2",mode="steal"} 0
node_cpu_seconds_total{cpu="2",mode="system"} 73257.94
node_cpu_seconds_total{cpu="2",mode="user"} 112932.46
node_cpu_seconds_total{cpu="3",mode="idle"} 2.7039725e+06
node_cpu_seconds_total{cpu="3",mode="iowait"} 10525.98
node_cpu_seconds_total{cpu="3",mode="irq"} 0
node_cpu_seconds_total{cpu="3",mode="nice"} 56.42
node_cpu_seconds_total{cpu="3",mode="softirq"} 3434.8
node_cpu_seconds_total{cpu="3",mode="steal"} 0
node_cpu_seconds_total{cpu="3",mode="system"} 71924.93
node_cpu_seconds_total{cpu="3",mode="user"} 111615.13
# HELP node_disk_discard_time_seconds_total This is the total number of seconds spent by all discards.
# TYPE node_disk_discard_time_seconds_total counter
node_disk_discard_time_seconds_total{device="mmcblk0"} 6.008
node_disk_discard_time_seconds_total{device="mmcblk0p1"} 0.11800000000000001
node_disk_discard_time_seconds_total{device="mmcblk0p2"} 5.889
# HELP node_disk_discarded_sectors_total The total number of sectors discarded successfully.
# TYPE node_disk_discarded_sectors_total counter
node_disk_discarded_sectors_total{device="mmcblk0"} 2.7187894e+08
node_disk_discarded_sectors_total{device="mmcblk0p1"} 4.57802e+06
node_disk_discarded_sectors_total{device="mmcblk0p2"} 2.6730092e+08
# HELP node_disk_discards_completed_total The total number of discards completed successfully.
# TYPE node_disk_discards_completed_total counter
node_disk_discards_completed_total{device="mmcblk0"} 1330
node_disk_discards_completed_total{device="mmcblk0p1"} 20
node_disk_discards_completed_total{device="mmcblk0p2"} 1310
# HELP node_disk_discards_merged_total The total number of discards merged.
# TYPE node_disk_discards_merged_total counter
node_disk_discards_merged_total{device="mmcblk0"} 306
node_disk_discards_merged_total{device="mmcblk0p1"} 20
node_disk_discards_merged_total{device="mmcblk0p2"} 286
# HELP node_disk_filesystem_info Info about disk filesystem.
# TYPE node_disk_filesystem_info gauge
node_disk_filesystem_info{device="mmcblk0p1",type="vfat",usage="filesystem",uuid="5DF9-E225",version="FAT32"} 1
node_disk_filesystem_info{device="mmcblk0p2",type="ext4",usage="filesystem",uuid="3b614a3f-4a65-4480-876a-8a998e01ac9b",version="1.0"} 1
# HELP node_disk_flush_requests_time_seconds_total This is the total number of seconds spent by all flush requests.
# TYPE node_disk_flush_requests_time_seconds_total counter
node_disk_flush_requests_time_seconds_total{device="mmcblk0"} 4597.003
node_disk_flush_requests_time_seconds_total{device="mmcblk0p1"} 0
node_disk_flush_requests_time_seconds_total{device="mmcblk0p2"} 0
# HELP node_disk_flush_requests_total The total number of flush requests completed successfully
# TYPE node_disk_flush_requests_total counter
node_disk_flush_requests_total{device="mmcblk0"} 2.0808855e+07
node_disk_flush_requests_total{device="mmcblk0p1"} 0
node_disk_flush_requests_total{device="mmcblk0p2"} 0
# HELP node_disk_info Info of /sys/block/<block_device>.
# TYPE node_disk_info gauge
node_disk_info{device="mmcblk0",major="179",minor="0",model="",path="platform-fe340000.mmc",revision="",serial="",wwn=""} 1
node_disk_info{device="mmcblk0p1",major="179",minor="1",model="",path="platform-fe340000.mmc",revision="",serial="",wwn=""} 1
node_disk_info{device="mmcblk0p2",major="179",minor="2",model="",path="platform-fe340000.mmc",revision="",serial="",wwn=""} 1
# HELP node_disk_io_now The number of I/Os currently in progress.
# TYPE node_disk_io_now gauge
node_disk_io_now{device="mmcblk0"} 0
node_disk_io_now{device="mmcblk0p1"} 0
node_disk_io_now{device="mmcblk0p2"} 0
# HELP node_disk_io_time_seconds_total Total seconds spent doing I/Os.
# TYPE node_disk_io_time_seconds_total counter
node_disk_io_time_seconds_total{device="mmcblk0"} 109481.804
node_disk_io_time_seconds_total{device="mmcblk0p1"} 4.172
node_disk_io_time_seconds_total{device="mmcblk0p2"} 109479.144
# HELP node_disk_io_time_weighted_seconds_total The weighted # of seconds spent doing I/Os.
# TYPE node_disk_io_time_weighted_seconds_total counter
node_disk_io_time_weighted_seconds_total{device="mmcblk0"} 254357.374
node_disk_io_time_weighted_seconds_total{device="mmcblk0p1"} 168.897
node_disk_io_time_weighted_seconds_total{device="mmcblk0p2"} 249591.36000000002
# HELP node_disk_read_bytes_total The total number of bytes read successfully.
# TYPE node_disk_read_bytes_total counter
node_disk_read_bytes_total{device="mmcblk0"} 1.142326272e+09
node_disk_read_bytes_total{device="mmcblk0p1"} 8.704e+06
node_disk_read_bytes_total{device="mmcblk0p2"} 1.132397568e+09
# HELP node_disk_read_time_seconds_total The total number of seconds spent by all reads.
# TYPE node_disk_read_time_seconds_total counter
node_disk_read_time_seconds_total{device="mmcblk0"} 72.763
node_disk_read_time_seconds_total{device="mmcblk0p1"} 0.8140000000000001
node_disk_read_time_seconds_total{device="mmcblk0p2"} 71.888
# HELP node_disk_reads_completed_total The total number of reads completed successfully.
# TYPE node_disk_reads_completed_total counter
node_disk_reads_completed_total{device="mmcblk0"} 26194
node_disk_reads_completed_total{device="mmcblk0p1"} 234
node_disk_reads_completed_total{device="mmcblk0p2"} 25885
# HELP node_disk_reads_merged_total The total number of reads merged.
# TYPE node_disk_reads_merged_total counter
node_disk_reads_merged_total{device="mmcblk0"} 4740
node_disk_reads_merged_total{device="mmcblk0p1"} 1119
node_disk_reads_merged_total{device="mmcblk0p2"} 3621
# HELP node_disk_write_time_seconds_total This is the total number of seconds spent by all writes.
# TYPE node_disk_write_time_seconds_total counter
node_disk_write_time_seconds_total{device="mmcblk0"} 249681.59900000002
node_disk_write_time_seconds_total{device="mmcblk0p1"} 167.964
node_disk_write_time_seconds_total{device="mmcblk0p2"} 249513.581
# HELP node_disk_writes_completed_total The total number of writes completed successfully.
# TYPE node_disk_writes_completed_total counter
node_disk_writes_completed_total{device="mmcblk0"} 6.356576e+07
node_disk_writes_completed_total{device="mmcblk0p1"} 749
node_disk_writes_completed_total{device="mmcblk0p2"} 6.3564908e+07
# HELP node_disk_writes_merged_total The number of writes merged.
# TYPE node_disk_writes_merged_total counter
node_disk_writes_merged_total{device="mmcblk0"} 9.074629e+06
node_disk_writes_merged_total{device="mmcblk0p1"} 1554
node_disk_writes_merged_total{device="mmcblk0p2"} 9.073075e+06
# HELP node_disk_written_bytes_total The total number of bytes written successfully.
# TYPE node_disk_written_bytes_total counter
node_disk_written_bytes_total{device="mmcblk0"} 2.61909222912e+11
node_disk_written_bytes_total{device="mmcblk0p1"} 8.3293696e+07
node_disk_written_bytes_total{device="mmcblk0p2"} 2.61825929216e+11
# HELP node_entropy_available_bits Bits of available entropy.
# TYPE node_entropy_available_bits gauge
node_entropy_available_bits 256
# HELP node_entropy_pool_size_bits Bits of entropy pool.
# TYPE node_entropy_pool_size_bits gauge
node_entropy_pool_size_bits 256
# HELP node_exporter_build_info A metric with a constant '1' value labeled by version, revision, branch, goversion from which node_exporter was built, and the goos and goarch for the build.
# TYPE node_exporter_build_info gauge
node_exporter_build_info{branch="HEAD",goarch="arm64",goos="linux",goversion="go1.21.4",revision="7333465abf9efba81876303bb57e6fadb946041b",tags="netgo osusergo static_build",version="1.7.0"} 1
# HELP node_filefd_allocated File descriptor statistics: allocated.
# TYPE node_filefd_allocated gauge
node_filefd_allocated 2080
# HELP node_filefd_maximum File descriptor statistics: maximum.
# TYPE node_filefd_maximum gauge
node_filefd_maximum 9.223372036854776e+18
# HELP node_filesystem_avail_bytes Filesystem space available to non-root users in bytes.
# TYPE node_filesystem_avail_bytes gauge
node_filesystem_avail_bytes{device="/dev/mmcblk0p1",fstype="vfat",mountpoint="/boot/firmware"} 4.6998528e+08
node_filesystem_avail_bytes{device="/dev/mmcblk0p2",fstype="ext4",mountpoint="/"} 1.12564281344e+11
node_filesystem_avail_bytes{device="shm",fstype="tmpfs",mountpoint="/run/containerd/io.containerd.grpc.v1.cri/sandboxes/0208f7a11dc33d5bc8bd289bad919bb17181316989d0b67797b9bc600eca5feb/shm"} 6.7108864e+07
node_filesystem_avail_bytes{device="shm",fstype="tmpfs",mountpoint="/run/containerd/io.containerd.grpc.v1.cri/sandboxes/11d4155c4c3ccf57a41200b7ec3de847c49956a051889aed26bcb0efe751d221/shm"} 6.7108864e+07
node_filesystem_avail_bytes{device="shm",fstype="tmpfs",mountpoint="/run/containerd/io.containerd.grpc.v1.cri/sandboxes/29e8b6a960d1f80aa5dba931d282e3e896f4689b6d27e0f29296860ac03fa6b4/shm"} 6.7108864e+07
node_filesystem_avail_bytes{device="shm",fstype="tmpfs",mountpoint="/run/containerd/io.containerd.grpc.v1.cri/sandboxes/3577c3db4143954a3f4213a5a6dedd3dfb336f135900eecf207414ad4770f1b0/shm"} 6.7108864e+07
node_filesystem_avail_bytes{device="shm",fstype="tmpfs",mountpoint="/run/containerd/io.containerd.grpc.v1.cri/sandboxes/576fad5789d19fda4bfcc5999d388e6f99e262000d11112356e37c6a929059ed/shm"} 6.7108864e+07
node_filesystem_avail_bytes{device="shm",fstype="tmpfs",mountpoint="/run/containerd/io.containerd.grpc.v1.cri/sandboxes/8524e37b55f671a6cb14491142d00badcfe7dc62a7e73540d107378f68b68667/shm"} 6.7108864e+07
node_filesystem_avail_bytes{device="shm",fstype="tmpfs",mountpoint="/run/containerd/io.containerd.grpc.v1.cri/sandboxes/a15cd8217349b0597cc3fb05844d99db669880444ca3957a26e5c57c326550c0/shm"} 6.7108864e+07
node_filesystem_avail_bytes{device="shm",fstype="tmpfs",mountpoint="/run/containerd/io.containerd.grpc.v1.cri/sandboxes/d2d3f63c7fd3e21f208a8a2a2d0428cc248f979655bc87ad89e38f6f93e7d1ac/shm"} 6.7108864e+07
node_filesystem_avail_bytes{device="shm",fstype="tmpfs",mountpoint="/run/containerd/io.containerd.grpc.v1.cri/sandboxes/e9738e9d4d1902e832e290dfac1f0a6b6a1d87ba172c64818a032f0ae131b124/shm"} 6.7108864e+07
node_filesystem_avail_bytes{device="shm",fstype="tmpfs",mountpoint="/run/containerd/io.containerd.grpc.v1.cri/sandboxes/eea73d4ab31da1cdcbbbfe69e4c1e3b2338d7b659fee3d8e05a33b3e6cf4638c/shm"} 6.7108864e+07
node_filesystem_avail_bytes{device="tmpfs",fstype="tmpfs",mountpoint="/run"} 8.16193536e+08
node_filesystem_avail_bytes{device="tmpfs",fstype="tmpfs",mountpoint="/run/lock"} 5.226496e+06
node_filesystem_avail_bytes{device="tmpfs",fstype="tmpfs",mountpoint="/run/user/1000"} 8.19064832e+08
# HELP node_filesystem_device_error Whether an error occurred while getting statistics for the given device.
# TYPE node_filesystem_device_error gauge
node_filesystem_device_error{device="/dev/mmcblk0p1",fstype="vfat",mountpoint="/boot/firmware"} 0
node_filesystem_device_error{device="/dev/mmcblk0p2",fstype="ext4",mountpoint="/"} 0
node_filesystem_device_error{device="shm",fstype="tmpfs",mountpoint="/run/containerd/io.containerd.grpc.v1.cri/sandboxes/0208f7a11dc33d5bc8bd289bad919bb17181316989d0b67797b9bc600eca5feb/shm"} 0
node_filesystem_device_error{device="shm",fstype="tmpfs",mountpoint="/run/containerd/io.containerd.grpc.v1.cri/sandboxes/11d4155c4c3ccf57a41200b7ec3de847c49956a051889aed26bcb0efe751d221/shm"} 0
node_filesystem_device_error{device="shm",fstype="tmpfs",mountpoint="/run/containerd/io.containerd.grpc.v1.cri/sandboxes/29e8b6a960d1f80aa5dba931d282e3e896f4689b6d27e0f29296860ac03fa6b4/shm"} 0
node_filesystem_device_error{device="shm",fstype="tmpfs",mountpoint="/run/containerd/io.containerd.grpc.v1.cri/sandboxes/3577c3db4143954a3f4213a5a6dedd3dfb336f135900eecf207414ad4770f1b0/shm"} 0
node_filesystem_device_error{device="shm",fstype="tmpfs",mountpoint="/run/containerd/io.containerd.grpc.v1.cri/sandboxes/576fad5789d19fda4bfcc5999d388e6f99e262000d11112356e37c6a929059ed/shm"} 0
node_filesystem_device_error{device="shm",fstype="tmpfs",mountpoint="/run/containerd/io.containerd.grpc.v1.cri/sandboxes/8524e37b55f671a6cb14491142d00badcfe7dc62a7e73540d107378f68b68667/shm"} 0
node_filesystem_device_error{device="shm",fstype="tmpfs",mountpoint="/run/containerd/io.containerd.grpc.v1.cri/sandboxes/a15cd8217349b0597cc3fb05844d99db669880444ca3957a26e5c57c326550c0/shm"} 0
node_filesystem_device_error{device="shm",fstype="tmpfs",mountpoint="/run/containerd/io.containerd.grpc.v1.cri/sandboxes/d2d3f63c7fd3e21f208a8a2a2d0428cc248f979655bc87ad89e38f6f93e7d1ac/shm"} 0
node_filesystem_device_error{device="shm",fstype="tmpfs",mountpoint="/run/containerd/io.containerd.grpc.v1.cri/sandboxes/e9738e9d4d1902e832e290dfac1f0a6b6a1d87ba172c64818a032f0ae131b124/shm"} 0
node_filesystem_device_error{device="shm",fstype="tmpfs",mountpoint="/run/containerd/io.containerd.grpc.v1.cri/sandboxes/eea73d4ab31da1cdcbbbfe69e4c1e3b2338d7b659fee3d8e05a33b3e6cf4638c/shm"} 0
node_filesystem_device_error{device="tmpfs",fstype="tmpfs",mountpoint="/run"} 0
node_filesystem_device_error{device="tmpfs",fstype="tmpfs",mountpoint="/run/lock"} 0
node_filesystem_device_error{device="tmpfs",fstype="tmpfs",mountpoint="/run/user/1000"} 0
node_filesystem_device_error{device="tmpfs",fstype="tmpfs",mountpoint="/var/lib/kubelet/pods/0e619376-d2fe-4f79-bc74-64fe5b3c8232/volumes/kubernetes.io~projected/kube-api-access-2f5p9"} 1
node_filesystem_device_error{device="tmpfs",fstype="tmpfs",mountpoint="/var/lib/kubelet/pods/61bde493-1e9f-4d4d-b77f-1df095f775c4/volumes/kubernetes.io~projected/kube-api-access-rdrm2"} 1
node_filesystem_device_error{device="tmpfs",fstype="tmpfs",mountpoint="/var/lib/kubelet/pods/878c2007-167d-4437-b654-43ef9cc0a5f0/volumes/kubernetes.io~projected/kube-api-access-j5fzh"} 1
node_filesystem_device_error{device="tmpfs",fstype="tmpfs",mountpoint="/var/lib/kubelet/pods/9660f563-0f88-41aa-9d38-654911a04158/volumes/kubernetes.io~projected/kube-api-access-n494p"} 1
node_filesystem_device_error{device="tmpfs",fstype="tmpfs",mountpoint="/var/lib/kubelet/pods/c008ef0e-9212-42ce-9a34-6ccaf6b087d1/volumes/kubernetes.io~projected/kube-api-access-9c8sx"} 1
# HELP node_filesystem_files Filesystem total file nodes.
# TYPE node_filesystem_files gauge
node_filesystem_files{device="/dev/mmcblk0p1",fstype="vfat",mountpoint="/boot/firmware"} 0
node_filesystem_files{device="/dev/mmcblk0p2",fstype="ext4",mountpoint="/"} 7.500896e+06
node_filesystem_files{device="shm",fstype="tmpfs",mountpoint="/run/containerd/io.containerd.grpc.v1.cri/sandboxes/0208f7a11dc33d5bc8bd289bad919bb17181316989d0b67797b9bc600eca5feb/shm"} 999839
node_filesystem_files{device="shm",fstype="tmpfs",mountpoint="/run/containerd/io.containerd.grpc.v1.cri/sandboxes/11d4155c4c3ccf57a41200b7ec3de847c49956a051889aed26bcb0efe751d221/shm"} 999839
node_filesystem_files{device="shm",fstype="tmpfs",mountpoint="/run/containerd/io.containerd.grpc.v1.cri/sandboxes/29e8b6a960d1f80aa5dba931d282e3e896f4689b6d27e0f29296860ac03fa6b4/shm"} 999839
node_filesystem_files{device="shm",fstype="tmpfs",mountpoint="/run/containerd/io.containerd.grpc.v1.cri/sandboxes/3577c3db4143954a3f4213a5a6dedd3dfb336f135900eecf207414ad4770f1b0/shm"} 999839
node_filesystem_files{device="shm",fstype="tmpfs",mountpoint="/run/containerd/io.containerd.grpc.v1.cri/sandboxes/576fad5789d19fda4bfcc5999d388e6f99e262000d11112356e37c6a929059ed/shm"} 999839
node_filesystem_files{device="shm",fstype="tmpfs",mountpoint="/run/containerd/io.containerd.grpc.v1.cri/sandboxes/8524e37b55f671a6cb14491142d00badcfe7dc62a7e73540d107378f68b68667/shm"} 999839
node_filesystem_files{device="shm",fstype="tmpfs",mountpoint="/run/containerd/io.containerd.grpc.v1.cri/sandboxes/a15cd8217349b0597cc3fb05844d99db669880444ca3957a26e5c57c326550c0/shm"} 999839
node_filesystem_files{device="shm",fstype="tmpfs",mountpoint="/run/containerd/io.containerd.grpc.v1.cri/sandboxes/d2d3f63c7fd3e21f208a8a2a2d0428cc248f979655bc87ad89e38f6f93e7d1ac/shm"} 999839
node_filesystem_files{device="shm",fstype="tmpfs",mountpoint="/run/containerd/io.containerd.grpc.v1.cri/sandboxes/e9738e9d4d1902e832e290dfac1f0a6b6a1d87ba172c64818a032f0ae131b124/shm"} 999839
node_filesystem_files{device="shm",fstype="tmpfs",mountpoint="/run/containerd/io.containerd.grpc.v1.cri/sandboxes/eea73d4ab31da1cdcbbbfe69e4c1e3b2338d7b659fee3d8e05a33b3e6cf4638c/shm"} 999839
node_filesystem_files{device="tmpfs",fstype="tmpfs",mountpoint="/run"} 999839
node_filesystem_files{device="tmpfs",fstype="tmpfs",mountpoint="/run/lock"} 999839
node_filesystem_files{device="tmpfs",fstype="tmpfs",mountpoint="/run/user/1000"} 199967
# HELP node_filesystem_files_free Filesystem total free file nodes.
# TYPE node_filesystem_files_free gauge
node_filesystem_files_free{device="/dev/mmcblk0p1",fstype="vfat",mountpoint="/boot/firmware"} 0
node_filesystem_files_free{device="/dev/mmcblk0p2",fstype="ext4",mountpoint="/"} 7.421624e+06
node_filesystem_files_free{device="shm",fstype="tmpfs",mountpoint="/run/containerd/io.containerd.grpc.v1.cri/sandboxes/0208f7a11dc33d5bc8bd289bad919bb17181316989d0b67797b9bc600eca5feb/shm"} 999838
node_filesystem_files_free{device="shm",fstype="tmpfs",mountpoint="/run/containerd/io.containerd.grpc.v1.cri/sandboxes/11d4155c4c3ccf57a41200b7ec3de847c49956a051889aed26bcb0efe751d221/shm"} 999838
node_filesystem_files_free{device="shm",fstype="tmpfs",mountpoint="/run/containerd/io.containerd.grpc.v1.cri/sandboxes/29e8b6a960d1f80aa5dba931d282e3e896f4689b6d27e0f29296860ac03fa6b4/shm"} 999838
node_filesystem_files_free{device="shm",fstype="tmpfs",mountpoint="/run/containerd/io.containerd.grpc.v1.cri/sandboxes/3577c3db4143954a3f4213a5a6dedd3dfb336f135900eecf207414ad4770f1b0/shm"} 999838
node_filesystem_files_free{device="shm",fstype="tmpfs",mountpoint="/run/containerd/io.containerd.grpc.v1.cri/sandboxes/576fad5789d19fda4bfcc5999d388e6f99e262000d11112356e37c6a929059ed/shm"} 999838
node_filesystem_files_free{device="shm",fstype="tmpfs",mountpoint="/run/containerd/io.containerd.grpc.v1.cri/sandboxes/8524e37b55f671a6cb14491142d00badcfe7dc62a7e73540d107378f68b68667/shm"} 999838
node_filesystem_files_free{device="shm",fstype="tmpfs",mountpoint="/run/containerd/io.containerd.grpc.v1.cri/sandboxes/a15cd8217349b0597cc3fb05844d99db669880444ca3957a26e5c57c326550c0/shm"} 999838
node_filesystem_files_free{device="shm",fstype="tmpfs",mountpoint="/run/containerd/io.containerd.grpc.v1.cri/sandboxes/d2d3f63c7fd3e21f208a8a2a2d0428cc248f979655bc87ad89e38f6f93e7d1ac/shm"} 999838
node_filesystem_files_free{device="shm",fstype="tmpfs",mountpoint="/run/containerd/io.containerd.grpc.v1.cri/sandboxes/e9738e9d4d1902e832e290dfac1f0a6b6a1d87ba172c64818a032f0ae131b124/shm"} 999838
node_filesystem_files_free{device="shm",fstype="tmpfs",mountpoint="/run/containerd/io.containerd.grpc.v1.cri/sandboxes/eea73d4ab31da1cdcbbbfe69e4c1e3b2338d7b659fee3d8e05a33b3e6cf4638c/shm"} 999838
node_filesystem_files_free{device="tmpfs",fstype="tmpfs",mountpoint="/run"} 998519
node_filesystem_files_free{device="tmpfs",fstype="tmpfs",mountpoint="/run/lock"} 999833
node_filesystem_files_free{device="tmpfs",fstype="tmpfs",mountpoint="/run/user/1000"} 199947
# HELP node_filesystem_free_bytes Filesystem free space in bytes.
# TYPE node_filesystem_free_bytes gauge
node_filesystem_free_bytes{device="/dev/mmcblk0p1",fstype="vfat",mountpoint="/boot/firmware"} 4.6998528e+08
node_filesystem_free_bytes{device="/dev/mmcblk0p2",fstype="ext4",mountpoint="/"} 1.18947086336e+11
node_filesystem_free_bytes{device="shm",fstype="tmpfs",mountpoint="/run/containerd/io.containerd.grpc.v1.cri/sandboxes/0208f7a11dc33d5bc8bd289bad919bb17181316989d0b67797b9bc600eca5feb/shm"} 6.7108864e+07
node_filesystem_free_bytes{device="shm",fstype="tmpfs",mountpoint="/run/containerd/io.containerd.grpc.v1.cri/sandboxes/11d4155c4c3ccf57a41200b7ec3de847c49956a051889aed26bcb0efe751d221/shm"} 6.7108864e+07
node_filesystem_free_bytes{device="shm",fstype="tmpfs",mountpoint="/run/containerd/io.containerd.grpc.v1.cri/sandboxes/29e8b6a960d1f80aa5dba931d282e3e896f4689b6d27e0f29296860ac03fa6b4/shm"} 6.7108864e+07
node_filesystem_free_bytes{device="shm",fstype="tmpfs",mountpoint="/run/containerd/io.containerd.grpc.v1.cri/sandboxes/3577c3db4143954a3f4213a5a6dedd3dfb336f135900eecf207414ad4770f1b0/shm"} 6.7108864e+07
node_filesystem_free_bytes{device="shm",fstype="tmpfs",mountpoint="/run/containerd/io.containerd.grpc.v1.cri/sandboxes/576fad5789d19fda4bfcc5999d388e6f99e262000d11112356e37c6a929059ed/shm"} 6.7108864e+07
node_filesystem_free_bytes{device="shm",fstype="tmpfs",mountpoint="/run/containerd/io.containerd.grpc.v1.cri/sandboxes/8524e37b55f671a6cb14491142d00badcfe7dc62a7e73540d107378f68b68667/shm"} 6.7108864e+07
node_filesystem_free_bytes{device="shm",fstype="tmpfs",mountpoint="/run/containerd/io.containerd.grpc.v1.cri/sandboxes/a15cd8217349b0597cc3fb05844d99db669880444ca3957a26e5c57c326550c0/shm"} 6.7108864e+07
node_filesystem_free_bytes{device="shm",fstype="tmpfs",mountpoint="/run/containerd/io.containerd.grpc.v1.cri/sandboxes/d2d3f63c7fd3e21f208a8a2a2d0428cc248f979655bc87ad89e38f6f93e7d1ac/shm"} 6.7108864e+07
node_filesystem_free_bytes{device="shm",fstype="tmpfs",mountpoint="/run/containerd/io.containerd.grpc.v1.cri/sandboxes/e9738e9d4d1902e832e290dfac1f0a6b6a1d87ba172c64818a032f0ae131b124/shm"} 6.7108864e+07
node_filesystem_free_bytes{device="shm",fstype="tmpfs",mountpoint="/run/containerd/io.containerd.grpc.v1.cri/sandboxes/eea73d4ab31da1cdcbbbfe69e4c1e3b2338d7b659fee3d8e05a33b3e6cf4638c/shm"} 6.7108864e+07
node_filesystem_free_bytes{device="tmpfs",fstype="tmpfs",mountpoint="/run"} 8.16193536e+08
node_filesystem_free_bytes{device="tmpfs",fstype="tmpfs",mountpoint="/run/lock"} 5.226496e+06
node_filesystem_free_bytes{device="tmpfs",fstype="tmpfs",mountpoint="/run/user/1000"} 8.19064832e+08
# HELP node_filesystem_readonly Filesystem read-only status.
# TYPE node_filesystem_readonly gauge
node_filesystem_readonly{device="/dev/mmcblk0p1",fstype="vfat",mountpoint="/boot/firmware"} 0
node_filesystem_readonly{device="/dev/mmcblk0p2",fstype="ext4",mountpoint="/"} 0
node_filesystem_readonly{device="shm",fstype="tmpfs",mountpoint="/run/containerd/io.containerd.grpc.v1.cri/sandboxes/0208f7a11dc33d5bc8bd289bad919bb17181316989d0b67797b9bc600eca5feb/shm"} 0
node_filesystem_readonly{device="shm",fstype="tmpfs",mountpoint="/run/containerd/io.containerd.grpc.v1.cri/sandboxes/11d4155c4c3ccf57a41200b7ec3de847c49956a051889aed26bcb0efe751d221/shm"} 0
node_filesystem_readonly{device="shm",fstype="tmpfs",mountpoint="/run/containerd/io.containerd.grpc.v1.cri/sandboxes/29e8b6a960d1f80aa5dba931d282e3e896f4689b6d27e0f29296860ac03fa6b4/shm"} 0
node_filesystem_readonly{device="shm",fstype="tmpfs",mountpoint="/run/containerd/io.containerd.grpc.v1.cri/sandboxes/3577c3db4143954a3f4213a5a6dedd3dfb336f135900eecf207414ad4770f1b0/shm"} 0
node_filesystem_readonly{device="shm",fstype="tmpfs",mountpoint="/run/containerd/io.containerd.grpc.v1.cri/sandboxes/576fad5789d19fda4bfcc5999d388e6f99e262000d11112356e37c6a929059ed/shm"} 0
node_filesystem_readonly{device="shm",fstype="tmpfs",mountpoint="/run/containerd/io.containerd.grpc.v1.cri/sandboxes/8524e37b55f671a6cb14491142d00badcfe7dc62a7e73540d107378f68b68667/shm"} 0
node_filesystem_readonly{device="shm",fstype="tmpfs",mountpoint="/run/containerd/io.containerd.grpc.v1.cri/sandboxes/a15cd8217349b0597cc3fb05844d99db669880444ca3957a26e5c57c326550c0/shm"} 0
node_filesystem_readonly{device="shm",fstype="tmpfs",mountpoint="/run/containerd/io.containerd.grpc.v1.cri/sandboxes/d2d3f63c7fd3e21f208a8a2a2d0428cc248f979655bc87ad89e38f6f93e7d1ac/shm"} 0
node_filesystem_readonly{device="shm",fstype="tmpfs",mountpoint="/run/containerd/io.containerd.grpc.v1.cri/sandboxes/e9738e9d4d1902e832e290dfac1f0a6b6a1d87ba172c64818a032f0ae131b124/shm"} 0
node_filesystem_readonly{device="shm",fstype="tmpfs",mountpoint="/run/containerd/io.containerd.grpc.v1.cri/sandboxes/eea73d4ab31da1cdcbbbfe69e4c1e3b2338d7b659fee3d8e05a33b3e6cf4638c/shm"} 0
node_filesystem_readonly{device="tmpfs",fstype="tmpfs",mountpoint="/run"} 0
node_filesystem_readonly{device="tmpfs",fstype="tmpfs",mountpoint="/run/lock"} 0
node_filesystem_readonly{device="tmpfs",fstype="tmpfs",mountpoint="/run/user/1000"} 0
node_filesystem_readonly{device="tmpfs",fstype="tmpfs",mountpoint="/var/lib/kubelet/pods/0e619376-d2fe-4f79-bc74-64fe5b3c8232/volumes/kubernetes.io~projected/kube-api-access-2f5p9"} 0
node_filesystem_readonly{device="tmpfs",fstype="tmpfs",mountpoint="/var/lib/kubelet/pods/61bde493-1e9f-4d4d-b77f-1df095f775c4/volumes/kubernetes.io~projected/kube-api-access-rdrm2"} 0
node_filesystem_readonly{device="tmpfs",fstype="tmpfs",mountpoint="/var/lib/kubelet/pods/878c2007-167d-4437-b654-43ef9cc0a5f0/volumes/kubernetes.io~projected/kube-api-access-j5fzh"} 0
node_filesystem_readonly{device="tmpfs",fstype="tmpfs",mountpoint="/var/lib/kubelet/pods/9660f563-0f88-41aa-9d38-654911a04158/volumes/kubernetes.io~projected/kube-api-access-n494p"} 0
node_filesystem_readonly{device="tmpfs",fstype="tmpfs",mountpoint="/var/lib/kubelet/pods/c008ef0e-9212-42ce-9a34-6ccaf6b087d1/volumes/kubernetes.io~projected/kube-api-access-9c8sx"} 0
# HELP node_filesystem_size_bytes Filesystem size in bytes.
# TYPE node_filesystem_size_bytes gauge
node_filesystem_size_bytes{device="/dev/mmcblk0p1",fstype="vfat",mountpoint="/boot/firmware"} 5.34765568e+08
node_filesystem_size_bytes{device="/dev/mmcblk0p2",fstype="ext4",mountpoint="/"} 1.25321166848e+11
node_filesystem_size_bytes{device="shm",fstype="tmpfs",mountpoint="/run/containerd/io.containerd.grpc.v1.cri/sandboxes/0208f7a11dc33d5bc8bd289bad919bb17181316989d0b67797b9bc600eca5feb/shm"} 6.7108864e+07
node_filesystem_size_bytes{device="shm",fstype="tmpfs",mountpoint="/run/containerd/io.containerd.grpc.v1.cri/sandboxes/11d4155c4c3ccf57a41200b7ec3de847c49956a051889aed26bcb0efe751d221/shm"} 6.7108864e+07
node_filesystem_size_bytes{device="shm",fstype="tmpfs",mountpoint="/run/containerd/io.containerd.grpc.v1.cri/sandboxes/29e8b6a960d1f80aa5dba931d282e3e896f4689b6d27e0f29296860ac03fa6b4/shm"} 6.7108864e+07
node_filesystem_size_bytes{device="shm",fstype="tmpfs",mountpoint="/run/containerd/io.containerd.grpc.v1.cri/sandboxes/3577c3db4143954a3f4213a5a6dedd3dfb336f135900eecf207414ad4770f1b0/shm"} 6.7108864e+07
node_filesystem_size_bytes{device="shm",fstype="tmpfs",mountpoint="/run/containerd/io.containerd.grpc.v1.cri/sandboxes/576fad5789d19fda4bfcc5999d388e6f99e262000d11112356e37c6a929059ed/shm"} 6.7108864e+07
node_filesystem_size_bytes{device="shm",fstype="tmpfs",mountpoint="/run/containerd/io.containerd.grpc.v1.cri/sandboxes/8524e37b55f671a6cb14491142d00badcfe7dc62a7e73540d107378f68b68667/shm"} 6.7108864e+07
node_filesystem_size_bytes{device="shm",fstype="tmpfs",mountpoint="/run/containerd/io.containerd.grpc.v1.cri/sandboxes/a15cd8217349b0597cc3fb05844d99db669880444ca3957a26e5c57c326550c0/shm"} 6.7108864e+07
node_filesystem_size_bytes{device="shm",fstype="tmpfs",mountpoint="/run/containerd/io.containerd.grpc.v1.cri/sandboxes/d2d3f63c7fd3e21f208a8a2a2d0428cc248f979655bc87ad89e38f6f93e7d1ac/shm"} 6.7108864e+07
node_filesystem_size_bytes{device="shm",fstype="tmpfs",mountpoint="/run/containerd/io.containerd.grpc.v1.cri/sandboxes/e9738e9d4d1902e832e290dfac1f0a6b6a1d87ba172c64818a032f0ae131b124/shm"} 6.7108864e+07
node_filesystem_size_bytes{device="shm",fstype="tmpfs",mountpoint="/run/containerd/io.containerd.grpc.v1.cri/sandboxes/eea73d4ab31da1cdcbbbfe69e4c1e3b2338d7b659fee3d8e05a33b3e6cf4638c/shm"} 6.7108864e+07
node_filesystem_size_bytes{device="tmpfs",fstype="tmpfs",mountpoint="/run"} 8.19068928e+08
node_filesystem_size_bytes{device="tmpfs",fstype="tmpfs",mountpoint="/run/lock"} 5.24288e+06
node_filesystem_size_bytes{device="tmpfs",fstype="tmpfs",mountpoint="/run/user/1000"} 8.19064832e+08
# HELP node_forks_total Total number of forks.
# TYPE node_forks_total counter
node_forks_total 1.9002994e+07
# HELP node_hwmon_chip_names Annotation metric for human-readable chip names
# TYPE node_hwmon_chip_names gauge
node_hwmon_chip_names{chip="platform_gpio_fan_0",chip_name="gpio_fan"} 1
node_hwmon_chip_names{chip="soc:firmware_raspberrypi_hwmon",chip_name="rpi_volt"} 1
node_hwmon_chip_names{chip="thermal_thermal_zone0",chip_name="cpu_thermal"} 1
# HELP node_hwmon_fan_max_rpm Hardware monitor for fan revolutions per minute (max)
# TYPE node_hwmon_fan_max_rpm gauge
node_hwmon_fan_max_rpm{chip="platform_gpio_fan_0",sensor="fan1"} 5000
# HELP node_hwmon_fan_min_rpm Hardware monitor for fan revolutions per minute (min)
# TYPE node_hwmon_fan_min_rpm gauge
node_hwmon_fan_min_rpm{chip="platform_gpio_fan_0",sensor="fan1"} 0
# HELP node_hwmon_fan_rpm Hardware monitor for fan revolutions per minute (input)
# TYPE node_hwmon_fan_rpm gauge
node_hwmon_fan_rpm{chip="platform_gpio_fan_0",sensor="fan1"} 5000
# HELP node_hwmon_fan_target_rpm Hardware monitor for fan revolutions per minute (target)
# TYPE node_hwmon_fan_target_rpm gauge
node_hwmon_fan_target_rpm{chip="platform_gpio_fan_0",sensor="fan1"} 5000
# HELP node_hwmon_in_lcrit_alarm_volts Hardware monitor for voltage (lcrit_alarm)
# TYPE node_hwmon_in_lcrit_alarm_volts gauge
node_hwmon_in_lcrit_alarm_volts{chip="soc:firmware_raspberrypi_hwmon",sensor="in0"} 0
# HELP node_hwmon_pwm Hardware monitor pwm element
# TYPE node_hwmon_pwm gauge
node_hwmon_pwm{chip="platform_gpio_fan_0",sensor="pwm1"} 255
# HELP node_hwmon_pwm_enable Hardware monitor pwm element enable
# TYPE node_hwmon_pwm_enable gauge
node_hwmon_pwm_enable{chip="platform_gpio_fan_0",sensor="pwm1"} 1
# HELP node_hwmon_pwm_mode Hardware monitor pwm element mode
# TYPE node_hwmon_pwm_mode gauge
node_hwmon_pwm_mode{chip="platform_gpio_fan_0",sensor="pwm1"} 0
# HELP node_hwmon_temp_celsius Hardware monitor for temperature (input)
# TYPE node_hwmon_temp_celsius gauge
node_hwmon_temp_celsius{chip="thermal_thermal_zone0",sensor="temp0"} 27.745
node_hwmon_temp_celsius{chip="thermal_thermal_zone0",sensor="temp1"} 27.745
# HELP node_hwmon_temp_crit_celsius Hardware monitor for temperature (crit)
# TYPE node_hwmon_temp_crit_celsius gauge
node_hwmon_temp_crit_celsius{chip="thermal_thermal_zone0",sensor="temp1"} 110
# HELP node_intr_total Total number of interrupts serviced.
# TYPE node_intr_total counter
node_intr_total 1.0312668562e+10
# HELP node_ipvs_connections_total The total number of connections made.
# TYPE node_ipvs_connections_total counter
node_ipvs_connections_total 2907
# HELP node_ipvs_incoming_bytes_total The total amount of incoming data.
# TYPE node_ipvs_incoming_bytes_total counter
node_ipvs_incoming_bytes_total 2.77474522e+08
# HELP node_ipvs_incoming_packets_total The total number of incoming packets.
# TYPE node_ipvs_incoming_packets_total counter
node_ipvs_incoming_packets_total 3.761541e+06
# HELP node_ipvs_outgoing_bytes_total The total amount of outgoing data.
# TYPE node_ipvs_outgoing_bytes_total counter
node_ipvs_outgoing_bytes_total 7.406631703e+09
# HELP node_ipvs_outgoing_packets_total The total number of outgoing packets.
# TYPE node_ipvs_outgoing_packets_total counter
node_ipvs_outgoing_packets_total 4.224817e+06
# HELP node_load1 1m load average.
# TYPE node_load1 gauge
node_load1 0.87
# HELP node_load15 15m load average.
# TYPE node_load15 gauge
node_load15 0.63
# HELP node_load5 5m load average.
# TYPE node_load5 gauge
node_load5 0.58
# HELP node_memory_Active_anon_bytes Memory information field Active_anon_bytes.
# TYPE node_memory_Active_anon_bytes gauge
node_memory_Active_anon_bytes 1.043009536e+09
# HELP node_memory_Active_bytes Memory information field Active_bytes.
# TYPE node_memory_Active_bytes gauge
node_memory_Active_bytes 1.62168832e+09
# HELP node_memory_Active_file_bytes Memory information field Active_file_bytes.
# TYPE node_memory_Active_file_bytes gauge
node_memory_Active_file_bytes 5.78678784e+08
# HELP node_memory_AnonPages_bytes Memory information field AnonPages_bytes.
# TYPE node_memory_AnonPages_bytes gauge
node_memory_AnonPages_bytes 1.043357696e+09
# HELP node_memory_Bounce_bytes Memory information field Bounce_bytes.
# TYPE node_memory_Bounce_bytes gauge
node_memory_Bounce_bytes 0
# HELP node_memory_Buffers_bytes Memory information field Buffers_bytes.
# TYPE node_memory_Buffers_bytes gauge
node_memory_Buffers_bytes 1.36790016e+08
# HELP node_memory_Cached_bytes Memory information field Cached_bytes.
# TYPE node_memory_Cached_bytes gauge
node_memory_Cached_bytes 4.609712128e+09
# HELP node_memory_CmaFree_bytes Memory information field CmaFree_bytes.
# TYPE node_memory_CmaFree_bytes gauge
node_memory_CmaFree_bytes 5.25586432e+08
# HELP node_memory_CmaTotal_bytes Memory information field CmaTotal_bytes.
# TYPE node_memory_CmaTotal_bytes gauge
node_memory_CmaTotal_bytes 5.36870912e+08
# HELP node_memory_CommitLimit_bytes Memory information field CommitLimit_bytes.
# TYPE node_memory_CommitLimit_bytes gauge
node_memory_CommitLimit_bytes 4.095340544e+09
# HELP node_memory_Committed_AS_bytes Memory information field Committed_AS_bytes.
# TYPE node_memory_Committed_AS_bytes gauge
node_memory_Committed_AS_bytes 3.449647104e+09
# HELP node_memory_Dirty_bytes Memory information field Dirty_bytes.
# TYPE node_memory_Dirty_bytes gauge
node_memory_Dirty_bytes 65536
# HELP node_memory_Inactive_anon_bytes Memory information field Inactive_anon_bytes.
# TYPE node_memory_Inactive_anon_bytes gauge
node_memory_Inactive_anon_bytes 3.25632e+06
# HELP node_memory_Inactive_bytes Memory information field Inactive_bytes.
# TYPE node_memory_Inactive_bytes gauge
node_memory_Inactive_bytes 4.168126464e+09
# HELP node_memory_Inactive_file_bytes Memory information field Inactive_file_bytes.
# TYPE node_memory_Inactive_file_bytes gauge
node_memory_Inactive_file_bytes 4.164870144e+09
# HELP node_memory_KReclaimable_bytes Memory information field KReclaimable_bytes.
# TYPE node_memory_KReclaimable_bytes gauge
node_memory_KReclaimable_bytes 4.01215488e+08
# HELP node_memory_KernelStack_bytes Memory information field KernelStack_bytes.
# TYPE node_memory_KernelStack_bytes gauge
node_memory_KernelStack_bytes 8.667136e+06
# HELP node_memory_Mapped_bytes Memory information field Mapped_bytes.
# TYPE node_memory_Mapped_bytes gauge
node_memory_Mapped_bytes 6.4243712e+08
# HELP node_memory_MemAvailable_bytes Memory information field MemAvailable_bytes.
# TYPE node_memory_MemAvailable_bytes gauge
node_memory_MemAvailable_bytes 6.829756416e+09
# HELP node_memory_MemFree_bytes Memory information field MemFree_bytes.
# TYPE node_memory_MemFree_bytes gauge
node_memory_MemFree_bytes 1.837809664e+09
# HELP node_memory_MemTotal_bytes Memory information field MemTotal_bytes.
# TYPE node_memory_MemTotal_bytes gauge
node_memory_MemTotal_bytes 8.190685184e+09
# HELP node_memory_Mlocked_bytes Memory information field Mlocked_bytes.
# TYPE node_memory_Mlocked_bytes gauge
node_memory_Mlocked_bytes 0
# HELP node_memory_NFS_Unstable_bytes Memory information field NFS_Unstable_bytes.
# TYPE node_memory_NFS_Unstable_bytes gauge
node_memory_NFS_Unstable_bytes 0
# HELP node_memory_PageTables_bytes Memory information field PageTables_bytes.
# TYPE node_memory_PageTables_bytes gauge
node_memory_PageTables_bytes 1.128448e+07
# HELP node_memory_Percpu_bytes Memory information field Percpu_bytes.
# TYPE node_memory_Percpu_bytes gauge
node_memory_Percpu_bytes 3.52256e+06
# HELP node_memory_SReclaimable_bytes Memory information field SReclaimable_bytes.
# TYPE node_memory_SReclaimable_bytes gauge
node_memory_SReclaimable_bytes 4.01215488e+08
# HELP node_memory_SUnreclaim_bytes Memory information field SUnreclaim_bytes.
# TYPE node_memory_SUnreclaim_bytes gauge
node_memory_SUnreclaim_bytes 8.0576512e+07
# HELP node_memory_SecPageTables_bytes Memory information field SecPageTables_bytes.
# TYPE node_memory_SecPageTables_bytes gauge
node_memory_SecPageTables_bytes 0
# HELP node_memory_Shmem_bytes Memory information field Shmem_bytes.
# TYPE node_memory_Shmem_bytes gauge
node_memory_Shmem_bytes 2.953216e+06
# HELP node_memory_Slab_bytes Memory information field Slab_bytes.
# TYPE node_memory_Slab_bytes gauge
node_memory_Slab_bytes 4.81792e+08
# HELP node_memory_SwapCached_bytes Memory information field SwapCached_bytes.
# TYPE node_memory_SwapCached_bytes gauge
node_memory_SwapCached_bytes 0
# HELP node_memory_SwapFree_bytes Memory information field SwapFree_bytes.
# TYPE node_memory_SwapFree_bytes gauge
node_memory_SwapFree_bytes 0
# HELP node_memory_SwapTotal_bytes Memory information field SwapTotal_bytes.
# TYPE node_memory_SwapTotal_bytes gauge
node_memory_SwapTotal_bytes 0
# HELP node_memory_Unevictable_bytes Memory information field Unevictable_bytes.
# TYPE node_memory_Unevictable_bytes gauge
node_memory_Unevictable_bytes 0
# HELP node_memory_VmallocChunk_bytes Memory information field VmallocChunk_bytes.
# TYPE node_memory_VmallocChunk_bytes gauge
node_memory_VmallocChunk_bytes 0
# HELP node_memory_VmallocTotal_bytes Memory information field VmallocTotal_bytes.
# TYPE node_memory_VmallocTotal_bytes gauge
node_memory_VmallocTotal_bytes 2.65885319168e+11
# HELP node_memory_VmallocUsed_bytes Memory information field VmallocUsed_bytes.
# TYPE node_memory_VmallocUsed_bytes gauge
node_memory_VmallocUsed_bytes 2.3687168e+07
# HELP node_memory_WritebackTmp_bytes Memory information field WritebackTmp_bytes.
# TYPE node_memory_WritebackTmp_bytes gauge
node_memory_WritebackTmp_bytes 0
# HELP node_memory_Writeback_bytes Memory information field Writeback_bytes.
# TYPE node_memory_Writeback_bytes gauge
node_memory_Writeback_bytes 0
# HELP node_memory_Zswap_bytes Memory information field Zswap_bytes.
# TYPE node_memory_Zswap_bytes gauge
node_memory_Zswap_bytes 0
# HELP node_memory_Zswapped_bytes Memory information field Zswapped_bytes.
# TYPE node_memory_Zswapped_bytes gauge
node_memory_Zswapped_bytes 0
# HELP node_netstat_Icmp6_InErrors Statistic Icmp6InErrors.
# TYPE node_netstat_Icmp6_InErrors untyped
node_netstat_Icmp6_InErrors 0
# HELP node_netstat_Icmp6_InMsgs Statistic Icmp6InMsgs.
# TYPE node_netstat_Icmp6_InMsgs untyped
node_netstat_Icmp6_InMsgs 2
# HELP node_netstat_Icmp6_OutMsgs Statistic Icmp6OutMsgs.
# TYPE node_netstat_Icmp6_OutMsgs untyped
node_netstat_Icmp6_OutMsgs 1601
# HELP node_netstat_Icmp_InErrors Statistic IcmpInErrors.
# TYPE node_netstat_Icmp_InErrors untyped
node_netstat_Icmp_InErrors 1
# HELP node_netstat_Icmp_InMsgs Statistic IcmpInMsgs.
# TYPE node_netstat_Icmp_InMsgs untyped
node_netstat_Icmp_InMsgs 17
# HELP node_netstat_Icmp_OutMsgs Statistic IcmpOutMsgs.
# TYPE node_netstat_Icmp_OutMsgs untyped
node_netstat_Icmp_OutMsgs 14
# HELP node_netstat_Ip6_InOctets Statistic Ip6InOctets.
# TYPE node_netstat_Ip6_InOctets untyped
node_netstat_Ip6_InOctets 3.997070725e+09
# HELP node_netstat_Ip6_OutOctets Statistic Ip6OutOctets.
# TYPE node_netstat_Ip6_OutOctets untyped
node_netstat_Ip6_OutOctets 3.997073515e+09
# HELP node_netstat_IpExt_InOctets Statistic IpExtInOctets.
# TYPE node_netstat_IpExt_InOctets untyped
node_netstat_IpExt_InOctets 1.08144717251e+11
# HELP node_netstat_IpExt_OutOctets Statistic IpExtOutOctets.
# TYPE node_netstat_IpExt_OutOctets untyped
node_netstat_IpExt_OutOctets 1.56294035787e+11
# HELP node_netstat_Ip_Forwarding Statistic IpForwarding.
# TYPE node_netstat_Ip_Forwarding untyped
node_netstat_Ip_Forwarding 1
# HELP node_netstat_TcpExt_ListenDrops Statistic TcpExtListenDrops.
# TYPE node_netstat_TcpExt_ListenDrops untyped
node_netstat_TcpExt_ListenDrops 0
# HELP node_netstat_TcpExt_ListenOverflows Statistic TcpExtListenOverflows.
# TYPE node_netstat_TcpExt_ListenOverflows untyped
node_netstat_TcpExt_ListenOverflows 0
# HELP node_netstat_TcpExt_SyncookiesFailed Statistic TcpExtSyncookiesFailed.
# TYPE node_netstat_TcpExt_SyncookiesFailed untyped
node_netstat_TcpExt_SyncookiesFailed 0
# HELP node_netstat_TcpExt_SyncookiesRecv Statistic TcpExtSyncookiesRecv.
# TYPE node_netstat_TcpExt_SyncookiesRecv untyped
node_netstat_TcpExt_SyncookiesRecv 0
# HELP node_netstat_TcpExt_SyncookiesSent Statistic TcpExtSyncookiesSent.
# TYPE node_netstat_TcpExt_SyncookiesSent untyped
node_netstat_TcpExt_SyncookiesSent 0
# HELP node_netstat_TcpExt_TCPSynRetrans Statistic TcpExtTCPSynRetrans.
# TYPE node_netstat_TcpExt_TCPSynRetrans untyped
node_netstat_TcpExt_TCPSynRetrans 342
# HELP node_netstat_TcpExt_TCPTimeouts Statistic TcpExtTCPTimeouts.
# TYPE node_netstat_TcpExt_TCPTimeouts untyped
node_netstat_TcpExt_TCPTimeouts 513
# HELP node_netstat_Tcp_ActiveOpens Statistic TcpActiveOpens.
# TYPE node_netstat_Tcp_ActiveOpens untyped
node_netstat_Tcp_ActiveOpens 7.121624e+06
# HELP node_netstat_Tcp_CurrEstab Statistic TcpCurrEstab.
# TYPE node_netstat_Tcp_CurrEstab untyped
node_netstat_Tcp_CurrEstab 236
# HELP node_netstat_Tcp_InErrs Statistic TcpInErrs.
# TYPE node_netstat_Tcp_InErrs untyped
node_netstat_Tcp_InErrs 0
# HELP node_netstat_Tcp_InSegs Statistic TcpInSegs.
# TYPE node_netstat_Tcp_InSegs untyped
node_netstat_Tcp_InSegs 5.82648533e+08
# HELP node_netstat_Tcp_OutRsts Statistic TcpOutRsts.
# TYPE node_netstat_Tcp_OutRsts untyped
node_netstat_Tcp_OutRsts 5.798397e+06
# HELP node_netstat_Tcp_OutSegs Statistic TcpOutSegs.
# TYPE node_netstat_Tcp_OutSegs untyped
node_netstat_Tcp_OutSegs 6.13524809e+08
# HELP node_netstat_Tcp_PassiveOpens Statistic TcpPassiveOpens.
# TYPE node_netstat_Tcp_PassiveOpens untyped
node_netstat_Tcp_PassiveOpens 6.751246e+06
# HELP node_netstat_Tcp_RetransSegs Statistic TcpRetransSegs.
# TYPE node_netstat_Tcp_RetransSegs untyped
node_netstat_Tcp_RetransSegs 173853
# HELP node_netstat_Udp6_InDatagrams Statistic Udp6InDatagrams.
# TYPE node_netstat_Udp6_InDatagrams untyped
node_netstat_Udp6_InDatagrams 279
# HELP node_netstat_Udp6_InErrors Statistic Udp6InErrors.
# TYPE node_netstat_Udp6_InErrors untyped
node_netstat_Udp6_InErrors 0
# HELP node_netstat_Udp6_NoPorts Statistic Udp6NoPorts.
# TYPE node_netstat_Udp6_NoPorts untyped
node_netstat_Udp6_NoPorts 0
# HELP node_netstat_Udp6_OutDatagrams Statistic Udp6OutDatagrams.
# TYPE node_netstat_Udp6_OutDatagrams untyped
node_netstat_Udp6_OutDatagrams 236
# HELP node_netstat_Udp6_RcvbufErrors Statistic Udp6RcvbufErrors.
# TYPE node_netstat_Udp6_RcvbufErrors untyped
node_netstat_Udp6_RcvbufErrors 0
# HELP node_netstat_Udp6_SndbufErrors Statistic Udp6SndbufErrors.
# TYPE node_netstat_Udp6_SndbufErrors untyped
node_netstat_Udp6_SndbufErrors 0
# HELP node_netstat_UdpLite6_InErrors Statistic UdpLite6InErrors.
# TYPE node_netstat_UdpLite6_InErrors untyped
node_netstat_UdpLite6_InErrors 0
# HELP node_netstat_UdpLite_InErrors Statistic UdpLiteInErrors.
# TYPE node_netstat_UdpLite_InErrors untyped
node_netstat_UdpLite_InErrors 0
# HELP node_netstat_Udp_InDatagrams Statistic UdpInDatagrams.
# TYPE node_netstat_Udp_InDatagrams untyped
node_netstat_Udp_InDatagrams 6.547468e+06
# HELP node_netstat_Udp_InErrors Statistic UdpInErrors.
# TYPE node_netstat_Udp_InErrors untyped
node_netstat_Udp_InErrors 0
# HELP node_netstat_Udp_NoPorts Statistic UdpNoPorts.
# TYPE node_netstat_Udp_NoPorts untyped
node_netstat_Udp_NoPorts 9
# HELP node_netstat_Udp_OutDatagrams Statistic UdpOutDatagrams.
# TYPE node_netstat_Udp_OutDatagrams untyped
node_netstat_Udp_OutDatagrams 3.213419e+06
# HELP node_netstat_Udp_RcvbufErrors Statistic UdpRcvbufErrors.
# TYPE node_netstat_Udp_RcvbufErrors untyped
node_netstat_Udp_RcvbufErrors 0
# HELP node_netstat_Udp_SndbufErrors Statistic UdpSndbufErrors.
# TYPE node_netstat_Udp_SndbufErrors untyped
node_netstat_Udp_SndbufErrors 0
# HELP node_network_address_assign_type Network device property: address_assign_type
# TYPE node_network_address_assign_type gauge
node_network_address_assign_type{device="cali60e575ce8db"} 3
node_network_address_assign_type{device="cali85a56337055"} 3
node_network_address_assign_type{device="cali8c459f6702e"} 3
node_network_address_assign_type{device="eth0"} 0
node_network_address_assign_type{device="lo"} 0
node_network_address_assign_type{device="tunl0"} 0
node_network_address_assign_type{device="wlan0"} 0
# HELP node_network_carrier Network device property: carrier
# TYPE node_network_carrier gauge
node_network_carrier{device="cali60e575ce8db"} 1
node_network_carrier{device="cali85a56337055"} 1
node_network_carrier{device="cali8c459f6702e"} 1
node_network_carrier{device="eth0"} 1
node_network_carrier{device="lo"} 1
node_network_carrier{device="tunl0"} 1
node_network_carrier{device="wlan0"} 0
# HELP node_network_carrier_changes_total Network device property: carrier_changes_total
# TYPE node_network_carrier_changes_total counter
node_network_carrier_changes_total{device="cali60e575ce8db"} 4
node_network_carrier_changes_total{device="cali85a56337055"} 4
node_network_carrier_changes_total{device="cali8c459f6702e"} 4
node_network_carrier_changes_total{device="eth0"} 1
node_network_carrier_changes_total{device="lo"} 0
node_network_carrier_changes_total{device="tunl0"} 0
node_network_carrier_changes_total{device="wlan0"} 1
# HELP node_network_carrier_down_changes_total Network device property: carrier_down_changes_total
# TYPE node_network_carrier_down_changes_total counter
node_network_carrier_down_changes_total{device="cali60e575ce8db"} 2
node_network_carrier_down_changes_total{device="cali85a56337055"} 2
node_network_carrier_down_changes_total{device="cali8c459f6702e"} 2
node_network_carrier_down_changes_total{device="eth0"} 0
node_network_carrier_down_changes_total{device="lo"} 0
node_network_carrier_down_changes_total{device="tunl0"} 0
node_network_carrier_down_changes_total{device="wlan0"} 1
# HELP node_network_carrier_up_changes_total Network device property: carrier_up_changes_total
# TYPE node_network_carrier_up_changes_total counter
node_network_carrier_up_changes_total{device="cali60e575ce8db"} 2
node_network_carrier_up_changes_total{device="cali85a56337055"} 2
node_network_carrier_up_changes_total{device="cali8c459f6702e"} 2
node_network_carrier_up_changes_total{device="eth0"} 1
node_network_carrier_up_changes_total{device="lo"} 0
node_network_carrier_up_changes_total{device="tunl0"} 0
node_network_carrier_up_changes_total{device="wlan0"} 0
# HELP node_network_device_id Network device property: device_id
# TYPE node_network_device_id gauge
node_network_device_id{device="cali60e575ce8db"} 0
node_network_device_id{device="cali85a56337055"} 0
node_network_device_id{device="cali8c459f6702e"} 0
node_network_device_id{device="eth0"} 0
node_network_device_id{device="lo"} 0
node_network_device_id{device="tunl0"} 0
node_network_device_id{device="wlan0"} 0
# HELP node_network_dormant Network device property: dormant
# TYPE node_network_dormant gauge
node_network_dormant{device="cali60e575ce8db"} 0
node_network_dormant{device="cali85a56337055"} 0
node_network_dormant{device="cali8c459f6702e"} 0
node_network_dormant{device="eth0"} 0
node_network_dormant{device="lo"} 0
node_network_dormant{device="tunl0"} 0
node_network_dormant{device="wlan0"} 0
# HELP node_network_flags Network device property: flags
# TYPE node_network_flags gauge
node_network_flags{device="cali60e575ce8db"} 4099
node_network_flags{device="cali85a56337055"} 4099
node_network_flags{device="cali8c459f6702e"} 4099
node_network_flags{device="eth0"} 4099
node_network_flags{device="lo"} 9
node_network_flags{device="tunl0"} 129
node_network_flags{device="wlan0"} 4099
# HELP node_network_iface_id Network device property: iface_id
# TYPE node_network_iface_id gauge
node_network_iface_id{device="cali60e575ce8db"} 73
node_network_iface_id{device="cali85a56337055"} 74
node_network_iface_id{device="cali8c459f6702e"} 70
node_network_iface_id{device="eth0"} 2
node_network_iface_id{device="lo"} 1
node_network_iface_id{device="tunl0"} 18
node_network_iface_id{device="wlan0"} 3
# HELP node_network_iface_link Network device property: iface_link
# TYPE node_network_iface_link gauge
node_network_iface_link{device="cali60e575ce8db"} 4
node_network_iface_link{device="cali85a56337055"} 4
node_network_iface_link{device="cali8c459f6702e"} 4
node_network_iface_link{device="eth0"} 2
node_network_iface_link{device="lo"} 1
node_network_iface_link{device="tunl0"} 0
node_network_iface_link{device="wlan0"} 3
# HELP node_network_iface_link_mode Network device property: iface_link_mode
# TYPE node_network_iface_link_mode gauge
node_network_iface_link_mode{device="cali60e575ce8db"} 0
node_network_iface_link_mode{device="cali85a56337055"} 0
node_network_iface_link_mode{device="cali8c459f6702e"} 0
node_network_iface_link_mode{device="eth0"} 0
node_network_iface_link_mode{device="lo"} 0
node_network_iface_link_mode{device="tunl0"} 0
node_network_iface_link_mode{device="wlan0"} 1
# HELP node_network_info Non-numeric data from /sys/class/net/<iface>, value is always 1.
# TYPE node_network_info gauge
node_network_info{address="00:00:00:00",adminstate="up",broadcast="00:00:00:00",device="tunl0",duplex="",ifalias="",operstate="unknown"} 1
node_network_info{address="00:00:00:00:00:00",adminstate="up",broadcast="00:00:00:00:00:00",device="lo",duplex="",ifalias="",operstate="unknown"} 1
node_network_info{address="d8:3a:dd:89:c1:0b",adminstate="up",broadcast="ff:ff:ff:ff:ff:ff",device="eth0",duplex="full",ifalias="",operstate="up"} 1
node_network_info{address="d8:3a:dd:89:c1:0c",adminstate="up",broadcast="ff:ff:ff:ff:ff:ff",device="wlan0",duplex="",ifalias="",operstate="down"} 1
node_network_info{address="ee:ee:ee:ee:ee:ee",adminstate="up",broadcast="ff:ff:ff:ff:ff:ff",device="cali60e575ce8db",duplex="full",ifalias="",operstate="up"} 1
node_network_info{address="ee:ee:ee:ee:ee:ee",adminstate="up",broadcast="ff:ff:ff:ff:ff:ff",device="cali85a56337055",duplex="full",ifalias="",operstate="up"} 1
node_network_info{address="ee:ee:ee:ee:ee:ee",adminstate="up",broadcast="ff:ff:ff:ff:ff:ff",device="cali8c459f6702e",duplex="full",ifalias="",operstate="up"} 1
# HELP node_network_mtu_bytes Network device property: mtu_bytes
# TYPE node_network_mtu_bytes gauge
node_network_mtu_bytes{device="cali60e575ce8db"} 1480
node_network_mtu_bytes{device="cali85a56337055"} 1480
node_network_mtu_bytes{device="cali8c459f6702e"} 1480
node_network_mtu_bytes{device="eth0"} 1500
node_network_mtu_bytes{device="lo"} 65536
node_network_mtu_bytes{device="tunl0"} 1480
node_network_mtu_bytes{device="wlan0"} 1500
# HELP node_network_name_assign_type Network device property: name_assign_type
# TYPE node_network_name_assign_type gauge
node_network_name_assign_type{device="cali60e575ce8db"} 3
node_network_name_assign_type{device="cali85a56337055"} 3
node_network_name_assign_type{device="cali8c459f6702e"} 3
node_network_name_assign_type{device="eth0"} 1
node_network_name_assign_type{device="lo"} 2
# HELP node_network_net_dev_group Network device property: net_dev_group
# TYPE node_network_net_dev_group gauge
node_network_net_dev_group{device="cali60e575ce8db"} 0
node_network_net_dev_group{device="cali85a56337055"} 0
node_network_net_dev_group{device="cali8c459f6702e"} 0
node_network_net_dev_group{device="eth0"} 0
node_network_net_dev_group{device="lo"} 0
node_network_net_dev_group{device="tunl0"} 0
node_network_net_dev_group{device="wlan0"} 0
# HELP node_network_protocol_type Network device property: protocol_type
# TYPE node_network_protocol_type gauge
node_network_protocol_type{device="cali60e575ce8db"} 1
node_network_protocol_type{device="cali85a56337055"} 1
node_network_protocol_type{device="cali8c459f6702e"} 1
node_network_protocol_type{device="eth0"} 1
node_network_protocol_type{device="lo"} 772
node_network_protocol_type{device="tunl0"} 768
node_network_protocol_type{device="wlan0"} 1
# HELP node_network_receive_bytes_total Network device statistic receive_bytes.
# TYPE node_network_receive_bytes_total counter
node_network_receive_bytes_total{device="cali60e575ce8db"} 6.800154e+07
node_network_receive_bytes_total{device="cali85a56337055"} 6.6751833e+07
node_network_receive_bytes_total{device="cali8c459f6702e"} 5.9727975e+07
node_network_receive_bytes_total{device="eth0"} 5.6372248596e+10
node_network_receive_bytes_total{device="lo"} 6.0342387372e+10
node_network_receive_bytes_total{device="tunl0"} 3.599596e+06
node_network_receive_bytes_total{device="wlan0"} 0
# HELP node_network_receive_compressed_total Network device statistic receive_compressed.
# TYPE node_network_receive_compressed_total counter
node_network_receive_compressed_total{device="cali60e575ce8db"} 0
node_network_receive_compressed_total{device="cali85a56337055"} 0
node_network_receive_compressed_total{device="cali8c459f6702e"} 0
node_network_receive_compressed_total{device="eth0"} 0
node_network_receive_compressed_total{device="lo"} 0
node_network_receive_compressed_total{device="tunl0"} 0
node_network_receive_compressed_total{device="wlan0"} 0
# HELP node_network_receive_drop_total Network device statistic receive_drop.
# TYPE node_network_receive_drop_total counter
node_network_receive_drop_total{device="cali60e575ce8db"} 1
node_network_receive_drop_total{device="cali85a56337055"} 1
node_network_receive_drop_total{device="cali8c459f6702e"} 1
node_network_receive_drop_total{device="eth0"} 0
node_network_receive_drop_total{device="lo"} 0
node_network_receive_drop_total{device="tunl0"} 0
node_network_receive_drop_total{device="wlan0"} 0
# HELP node_network_receive_errs_total Network device statistic receive_errs.
# TYPE node_network_receive_errs_total counter
node_network_receive_errs_total{device="cali60e575ce8db"} 0
node_network_receive_errs_total{device="cali85a56337055"} 0
node_network_receive_errs_total{device="cali8c459f6702e"} 0
node_network_receive_errs_total{device="eth0"} 0
node_network_receive_errs_total{device="lo"} 0
node_network_receive_errs_total{device="tunl0"} 0
node_network_receive_errs_total{device="wlan0"} 0
# HELP node_network_receive_fifo_total Network device statistic receive_fifo.
# TYPE node_network_receive_fifo_total counter
node_network_receive_fifo_total{device="cali60e575ce8db"} 0
node_network_receive_fifo_total{device="cali85a56337055"} 0
node_network_receive_fifo_total{device="cali8c459f6702e"} 0
node_network_receive_fifo_total{device="eth0"} 0
node_network_receive_fifo_total{device="lo"} 0
node_network_receive_fifo_total{device="tunl0"} 0
node_network_receive_fifo_total{device="wlan0"} 0
# HELP node_network_receive_frame_total Network device statistic receive_frame.
# TYPE node_network_receive_frame_total counter
node_network_receive_frame_total{device="cali60e575ce8db"} 0
node_network_receive_frame_total{device="cali85a56337055"} 0
node_network_receive_frame_total{device="cali8c459f6702e"} 0
node_network_receive_frame_total{device="eth0"} 0
node_network_receive_frame_total{device="lo"} 0
node_network_receive_frame_total{device="tunl0"} 0
node_network_receive_frame_total{device="wlan0"} 0
# HELP node_network_receive_multicast_total Network device statistic receive_multicast.
# TYPE node_network_receive_multicast_total counter
node_network_receive_multicast_total{device="cali60e575ce8db"} 0
node_network_receive_multicast_total{device="cali85a56337055"} 0
node_network_receive_multicast_total{device="cali8c459f6702e"} 0
node_network_receive_multicast_total{device="eth0"} 3.336362e+06
node_network_receive_multicast_total{device="lo"} 0
node_network_receive_multicast_total{device="tunl0"} 0
node_network_receive_multicast_total{device="wlan0"} 0
# HELP node_network_receive_nohandler_total Network device statistic receive_nohandler.
# TYPE node_network_receive_nohandler_total counter
node_network_receive_nohandler_total{device="cali60e575ce8db"} 0
node_network_receive_nohandler_total{device="cali85a56337055"} 0
node_network_receive_nohandler_total{device="cali8c459f6702e"} 0
node_network_receive_nohandler_total{device="eth0"} 0
node_network_receive_nohandler_total{device="lo"} 0
node_network_receive_nohandler_total{device="tunl0"} 0
node_network_receive_nohandler_total{device="wlan0"} 0
# HELP node_network_receive_packets_total Network device statistic receive_packets.
# TYPE node_network_receive_packets_total counter
node_network_receive_packets_total{device="cali60e575ce8db"} 800641
node_network_receive_packets_total{device="cali85a56337055"} 781891
node_network_receive_packets_total{device="cali8c459f6702e"} 680023
node_network_receive_packets_total{device="eth0"} 3.3310639e+08
node_network_receive_packets_total{device="lo"} 2.57029971e+08
node_network_receive_packets_total{device="tunl0"} 39699
node_network_receive_packets_total{device="wlan0"} 0
# HELP node_network_speed_bytes Network device property: speed_bytes
# TYPE node_network_speed_bytes gauge
node_network_speed_bytes{device="cali60e575ce8db"} 1.25e+09
node_network_speed_bytes{device="cali85a56337055"} 1.25e+09
node_network_speed_bytes{device="cali8c459f6702e"} 1.25e+09
node_network_speed_bytes{device="eth0"} 1.25e+08
# HELP node_network_transmit_bytes_total Network device statistic transmit_bytes.
# TYPE node_network_transmit_bytes_total counter
node_network_transmit_bytes_total{device="cali60e575ce8db"} 5.2804647e+07
node_network_transmit_bytes_total{device="cali85a56337055"} 5.4239763e+07
node_network_transmit_bytes_total{device="cali8c459f6702e"} 1.115901473e+09
node_network_transmit_bytes_total{device="eth0"} 1.02987658518e+11
node_network_transmit_bytes_total{device="lo"} 6.0342387372e+10
node_network_transmit_bytes_total{device="tunl0"} 8.407628e+06
node_network_transmit_bytes_total{device="wlan0"} 0
# HELP node_network_transmit_carrier_total Network device statistic transmit_carrier.
# TYPE node_network_transmit_carrier_total counter
node_network_transmit_carrier_total{device="cali60e575ce8db"} 0
node_network_transmit_carrier_total{device="cali85a56337055"} 0
node_network_transmit_carrier_total{device="cali8c459f6702e"} 0
node_network_transmit_carrier_total{device="eth0"} 0
node_network_transmit_carrier_total{device="lo"} 0
node_network_transmit_carrier_total{device="tunl0"} 0
node_network_transmit_carrier_total{device="wlan0"} 0
# HELP node_network_transmit_colls_total Network device statistic transmit_colls.
# TYPE node_network_transmit_colls_total counter
node_network_transmit_colls_total{device="cali60e575ce8db"} 0
node_network_transmit_colls_total{device="cali85a56337055"} 0
node_network_transmit_colls_total{device="cali8c459f6702e"} 0
node_network_transmit_colls_total{device="eth0"} 0
node_network_transmit_colls_total{device="lo"} 0
node_network_transmit_colls_total{device="tunl0"} 0
node_network_transmit_colls_total{device="wlan0"} 0
# HELP node_network_transmit_compressed_total Network device statistic transmit_compressed.
# TYPE node_network_transmit_compressed_total counter
node_network_transmit_compressed_total{device="cali60e575ce8db"} 0
node_network_transmit_compressed_total{device="cali85a56337055"} 0
node_network_transmit_compressed_total{device="cali8c459f6702e"} 0
node_network_transmit_compressed_total{device="eth0"} 0
node_network_transmit_compressed_total{device="lo"} 0
node_network_transmit_compressed_total{device="tunl0"} 0
node_network_transmit_compressed_total{device="wlan0"} 0
# HELP node_network_transmit_drop_total Network device statistic transmit_drop.
# TYPE node_network_transmit_drop_total counter
node_network_transmit_drop_total{device="cali60e575ce8db"} 0
node_network_transmit_drop_total{device="cali85a56337055"} 0
node_network_transmit_drop_total{device="cali8c459f6702e"} 0
node_network_transmit_drop_total{device="eth0"} 0
node_network_transmit_drop_total{device="lo"} 0
node_network_transmit_drop_total{device="tunl0"} 0
node_network_transmit_drop_total{device="wlan0"} 0
# HELP node_network_transmit_errs_total Network device statistic transmit_errs.
# TYPE node_network_transmit_errs_total counter
node_network_transmit_errs_total{device="cali60e575ce8db"} 0
node_network_transmit_errs_total{device="cali85a56337055"} 0
node_network_transmit_errs_total{device="cali8c459f6702e"} 0
node_network_transmit_errs_total{device="eth0"} 0
node_network_transmit_errs_total{device="lo"} 0
node_network_transmit_errs_total{device="tunl0"} 0
node_network_transmit_errs_total{device="wlan0"} 0
# HELP node_network_transmit_fifo_total Network device statistic transmit_fifo.
# TYPE node_network_transmit_fifo_total counter
node_network_transmit_fifo_total{device="cali60e575ce8db"} 0
node_network_transmit_fifo_total{device="cali85a56337055"} 0
node_network_transmit_fifo_total{device="cali8c459f6702e"} 0
node_network_transmit_fifo_total{device="eth0"} 0
node_network_transmit_fifo_total{device="lo"} 0
node_network_transmit_fifo_total{device="tunl0"} 0
node_network_transmit_fifo_total{device="wlan0"} 0
# HELP node_network_transmit_packets_total Network device statistic transmit_packets.
# TYPE node_network_transmit_packets_total counter
node_network_transmit_packets_total{device="cali60e575ce8db"} 560412
node_network_transmit_packets_total{device="cali85a56337055"} 582260
node_network_transmit_packets_total{device="cali8c459f6702e"} 733054
node_network_transmit_packets_total{device="eth0"} 3.54151866e+08
node_network_transmit_packets_total{device="lo"} 2.57029971e+08
node_network_transmit_packets_total{device="tunl0"} 39617
node_network_transmit_packets_total{device="wlan0"} 0
# HELP node_network_transmit_queue_length Network device property: transmit_queue_length
# TYPE node_network_transmit_queue_length gauge
node_network_transmit_queue_length{device="cali60e575ce8db"} 0
node_network_transmit_queue_length{device="cali85a56337055"} 0
node_network_transmit_queue_length{device="cali8c459f6702e"} 0
node_network_transmit_queue_length{device="eth0"} 1000
node_network_transmit_queue_length{device="lo"} 1000
node_network_transmit_queue_length{device="tunl0"} 1000
node_network_transmit_queue_length{device="wlan0"} 1000
# HELP node_network_up Value is 1 if operstate is 'up', 0 otherwise.
# TYPE node_network_up gauge
node_network_up{device="cali60e575ce8db"} 1
node_network_up{device="cali85a56337055"} 1
node_network_up{device="cali8c459f6702e"} 1
node_network_up{device="eth0"} 1
node_network_up{device="lo"} 0
node_network_up{device="tunl0"} 0
node_network_up{device="wlan0"} 0
# HELP node_nf_conntrack_entries Number of currently allocated flow entries for connection tracking.
# TYPE node_nf_conntrack_entries gauge
node_nf_conntrack_entries 474
# HELP node_nf_conntrack_entries_limit Maximum size of connection tracking table.
# TYPE node_nf_conntrack_entries_limit gauge
node_nf_conntrack_entries_limit 131072
# HELP node_nfs_connections_total Total number of NFSd TCP connections.
# TYPE node_nfs_connections_total counter
node_nfs_connections_total 0
# HELP node_nfs_packets_total Total NFSd network packets (sent+received) by protocol type.
# TYPE node_nfs_packets_total counter
node_nfs_packets_total{protocol="tcp"} 0
node_nfs_packets_total{protocol="udp"} 0
# HELP node_nfs_requests_total Number of NFS procedures invoked.
# TYPE node_nfs_requests_total counter
node_nfs_requests_total{method="Access",proto="3"} 0
node_nfs_requests_total{method="Access",proto="4"} 0
node_nfs_requests_total{method="Allocate",proto="4"} 0
node_nfs_requests_total{method="BindConnToSession",proto="4"} 0
node_nfs_requests_total{method="Clone",proto="4"} 0
node_nfs_requests_total{method="Close",proto="4"} 0
node_nfs_requests_total{method="Commit",proto="3"} 0
node_nfs_requests_total{method="Commit",proto="4"} 0
node_nfs_requests_total{method="Create",proto="2"} 0
node_nfs_requests_total{method="Create",proto="3"} 0
node_nfs_requests_total{method="Create",proto="4"} 0
node_nfs_requests_total{method="CreateSession",proto="4"} 0
node_nfs_requests_total{method="DeAllocate",proto="4"} 0
node_nfs_requests_total{method="DelegReturn",proto="4"} 0
node_nfs_requests_total{method="DestroyClientID",proto="4"} 0
node_nfs_requests_total{method="DestroySession",proto="4"} 0
node_nfs_requests_total{method="ExchangeID",proto="4"} 0
node_nfs_requests_total{method="FreeStateID",proto="4"} 0
node_nfs_requests_total{method="FsInfo",proto="3"} 0
node_nfs_requests_total{method="FsInfo",proto="4"} 0
node_nfs_requests_total{method="FsLocations",proto="4"} 0
node_nfs_requests_total{method="FsStat",proto="2"} 0
node_nfs_requests_total{method="FsStat",proto="3"} 0
node_nfs_requests_total{method="FsidPresent",proto="4"} 0
node_nfs_requests_total{method="GetACL",proto="4"} 0
node_nfs_requests_total{method="GetAttr",proto="2"} 0
node_nfs_requests_total{method="GetAttr",proto="3"} 0
node_nfs_requests_total{method="GetDeviceInfo",proto="4"} 0
node_nfs_requests_total{method="GetDeviceList",proto="4"} 0
node_nfs_requests_total{method="GetLeaseTime",proto="4"} 0
node_nfs_requests_total{method="Getattr",proto="4"} 0
node_nfs_requests_total{method="LayoutCommit",proto="4"} 0
node_nfs_requests_total{method="LayoutGet",proto="4"} 0
node_nfs_requests_total{method="LayoutReturn",proto="4"} 0
node_nfs_requests_total{method="LayoutStats",proto="4"} 0
node_nfs_requests_total{method="Link",proto="2"} 0
node_nfs_requests_total{method="Link",proto="3"} 0
node_nfs_requests_total{method="Link",proto="4"} 0
node_nfs_requests_total{method="Lock",proto="4"} 0
node_nfs_requests_total{method="Lockt",proto="4"} 0
node_nfs_requests_total{method="Locku",proto="4"} 0
node_nfs_requests_total{method="Lookup",proto="2"} 0
node_nfs_requests_total{method="Lookup",proto="3"} 0
node_nfs_requests_total{method="Lookup",proto="4"} 0
node_nfs_requests_total{method="LookupRoot",proto="4"} 0
node_nfs_requests_total{method="MkDir",proto="2"} 0
node_nfs_requests_total{method="MkDir",proto="3"} 0
node_nfs_requests_total{method="MkNod",proto="3"} 0
node_nfs_requests_total{method="Null",proto="2"} 0
node_nfs_requests_total{method="Null",proto="3"} 0
node_nfs_requests_total{method="Null",proto="4"} 0
node_nfs_requests_total{method="Open",proto="4"} 0
node_nfs_requests_total{method="OpenConfirm",proto="4"} 0
node_nfs_requests_total{method="OpenDowngrade",proto="4"} 0
node_nfs_requests_total{method="OpenNoattr",proto="4"} 0
node_nfs_requests_total{method="PathConf",proto="3"} 0
node_nfs_requests_total{method="Pathconf",proto="4"} 0
node_nfs_requests_total{method="Read",proto="2"} 0
node_nfs_requests_total{method="Read",proto="3"} 0
node_nfs_requests_total{method="Read",proto="4"} 0
node_nfs_requests_total{method="ReadDir",proto="2"} 0
node_nfs_requests_total{method="ReadDir",proto="3"} 0
node_nfs_requests_total{method="ReadDir",proto="4"} 0
node_nfs_requests_total{method="ReadDirPlus",proto="3"} 0
node_nfs_requests_total{method="ReadLink",proto="2"} 0
node_nfs_requests_total{method="ReadLink",proto="3"} 0
node_nfs_requests_total{method="ReadLink",proto="4"} 0
node_nfs_requests_total{method="ReclaimComplete",proto="4"} 0
node_nfs_requests_total{method="ReleaseLockowner",proto="4"} 0
node_nfs_requests_total{method="Remove",proto="2"} 0
node_nfs_requests_total{method="Remove",proto="3"} 0
node_nfs_requests_total{method="Remove",proto="4"} 0
node_nfs_requests_total{method="Rename",proto="2"} 0
node_nfs_requests_total{method="Rename",proto="3"} 0
node_nfs_requests_total{method="Rename",proto="4"} 0
node_nfs_requests_total{method="Renew",proto="4"} 0
node_nfs_requests_total{method="RmDir",proto="2"} 0
node_nfs_requests_total{method="RmDir",proto="3"} 0
node_nfs_requests_total{method="Root",proto="2"} 0
node_nfs_requests_total{method="Secinfo",proto="4"} 0
node_nfs_requests_total{method="SecinfoNoName",proto="4"} 0
node_nfs_requests_total{method="Seek",proto="4"} 0
node_nfs_requests_total{method="Sequence",proto="4"} 0
node_nfs_requests_total{method="ServerCaps",proto="4"} 0
node_nfs_requests_total{method="SetACL",proto="4"} 0
node_nfs_requests_total{method="SetAttr",proto="2"} 0
node_nfs_requests_total{method="SetAttr",proto="3"} 0
node_nfs_requests_total{method="SetClientID",proto="4"} 0
node_nfs_requests_total{method="SetClientIDConfirm",proto="4"} 0
node_nfs_requests_total{method="Setattr",proto="4"} 0
node_nfs_requests_total{method="StatFs",proto="4"} 0
node_nfs_requests_total{method="SymLink",proto="2"} 0
node_nfs_requests_total{method="SymLink",proto="3"} 0
node_nfs_requests_total{method="Symlink",proto="4"} 0
node_nfs_requests_total{method="TestStateID",proto="4"} 0
node_nfs_requests_total{method="WrCache",proto="2"} 0
node_nfs_requests_total{method="Write",proto="2"} 0
node_nfs_requests_total{method="Write",proto="3"} 0
node_nfs_requests_total{method="Write",proto="4"} 0
# HELP node_nfs_rpc_authentication_refreshes_total Number of RPC authentication refreshes performed.
# TYPE node_nfs_rpc_authentication_refreshes_total counter
node_nfs_rpc_authentication_refreshes_total 0
# HELP node_nfs_rpc_retransmissions_total Number of RPC transmissions performed.
# TYPE node_nfs_rpc_retransmissions_total counter
node_nfs_rpc_retransmissions_total 0
# HELP node_nfs_rpcs_total Total number of RPCs performed.
# TYPE node_nfs_rpcs_total counter
node_nfs_rpcs_total 0
# HELP node_os_info A metric with a constant '1' value labeled by build_id, id, id_like, image_id, image_version, name, pretty_name, variant, variant_id, version, version_codename, version_id.
# TYPE node_os_info gauge
node_os_info{build_id="",id="debian",id_like="",image_id="",image_version="",name="Debian GNU/Linux",pretty_name="Debian GNU/Linux 12 (bookworm)",variant="",variant_id="",version="12 (bookworm)",version_codename="bookworm",version_id="12"} 1
# HELP node_os_version Metric containing the major.minor part of the OS version.
# TYPE node_os_version gauge
node_os_version{id="debian",id_like="",name="Debian GNU/Linux"} 12
# HELP node_procs_blocked Number of processes blocked waiting for I/O to complete.
# TYPE node_procs_blocked gauge
node_procs_blocked 0
# HELP node_procs_running Number of processes in runnable state.
# TYPE node_procs_running gauge
node_procs_running 2
# HELP node_schedstat_running_seconds_total Number of seconds CPU spent running a process.
# TYPE node_schedstat_running_seconds_total counter
node_schedstat_running_seconds_total{cpu="0"} 193905.40964483
node_schedstat_running_seconds_total{cpu="1"} 201807.778053838
node_schedstat_running_seconds_total{cpu="2"} 202480.951626566
node_schedstat_running_seconds_total{cpu="3"} 199368.582085578
# HELP node_schedstat_timeslices_total Number of timeslices executed by CPU.
# TYPE node_schedstat_timeslices_total counter
node_schedstat_timeslices_total{cpu="0"} 2.671310666e+09
node_schedstat_timeslices_total{cpu="1"} 2.839935261e+09
node_schedstat_timeslices_total{cpu="2"} 2.840250945e+09
node_schedstat_timeslices_total{cpu="3"} 2.791566809e+09
# HELP node_schedstat_waiting_seconds_total Number of seconds spent by processing waiting for this CPU.
# TYPE node_schedstat_waiting_seconds_total counter
node_schedstat_waiting_seconds_total{cpu="0"} 146993.907550125
node_schedstat_waiting_seconds_total{cpu="1"} 148954.872956911
node_schedstat_waiting_seconds_total{cpu="2"} 149496.824640957
node_schedstat_waiting_seconds_total{cpu="3"} 148325.351612478
# HELP node_scrape_collector_duration_seconds node_exporter: Duration of a collector scrape.
# TYPE node_scrape_collector_duration_seconds gauge
node_scrape_collector_duration_seconds{collector="arp"} 0.000472051
node_scrape_collector_duration_seconds{collector="bcache"} 9.7776e-05
node_scrape_collector_duration_seconds{collector="bonding"} 0.00025022
node_scrape_collector_duration_seconds{collector="btrfs"} 0.018567631
node_scrape_collector_duration_seconds{collector="conntrack"} 0.014180114
node_scrape_collector_duration_seconds{collector="cpu"} 0.004748662
node_scrape_collector_duration_seconds{collector="cpufreq"} 0.049445245
node_scrape_collector_duration_seconds{collector="diskstats"} 0.001468727
node_scrape_collector_duration_seconds{collector="dmi"} 1.093e-06
node_scrape_collector_duration_seconds{collector="edac"} 7.6574e-05
node_scrape_collector_duration_seconds{collector="entropy"} 0.000781326
node_scrape_collector_duration_seconds{collector="fibrechannel"} 3.0574e-05
node_scrape_collector_duration_seconds{collector="filefd"} 0.000214998
node_scrape_collector_duration_seconds{collector="filesystem"} 0.041031802
node_scrape_collector_duration_seconds{collector="hwmon"} 0.007842633
node_scrape_collector_duration_seconds{collector="infiniband"} 4.1777e-05
node_scrape_collector_duration_seconds{collector="ipvs"} 0.000964547
node_scrape_collector_duration_seconds{collector="loadavg"} 0.000368979
node_scrape_collector_duration_seconds{collector="mdadm"} 7.6555e-05
node_scrape_collector_duration_seconds{collector="meminfo"} 0.001052527
node_scrape_collector_duration_seconds{collector="netclass"} 0.036469213
node_scrape_collector_duration_seconds{collector="netdev"} 0.002758901
node_scrape_collector_duration_seconds{collector="netstat"} 0.002033075
node_scrape_collector_duration_seconds{collector="nfs"} 0.000542699
node_scrape_collector_duration_seconds{collector="nfsd"} 0.000331331
node_scrape_collector_duration_seconds{collector="nvme"} 0.000140017
node_scrape_collector_duration_seconds{collector="os"} 0.000326923
node_scrape_collector_duration_seconds{collector="powersupplyclass"} 0.000183962
node_scrape_collector_duration_seconds{collector="pressure"} 6.4647e-05
node_scrape_collector_duration_seconds{collector="rapl"} 0.000149461
node_scrape_collector_duration_seconds{collector="schedstat"} 0.000511218
node_scrape_collector_duration_seconds{collector="selinux"} 0.000327182
node_scrape_collector_duration_seconds{collector="sockstat"} 0.001023898
node_scrape_collector_duration_seconds{collector="softnet"} 0.000578402
node_scrape_collector_duration_seconds{collector="stat"} 0.013851062
node_scrape_collector_duration_seconds{collector="tapestats"} 0.000176499
node_scrape_collector_duration_seconds{collector="textfile"} 5.7296e-05
node_scrape_collector_duration_seconds{collector="thermal_zone"} 0.017899137
node_scrape_collector_duration_seconds{collector="time"} 0.000422885
node_scrape_collector_duration_seconds{collector="timex"} 0.000182517
node_scrape_collector_duration_seconds{collector="udp_queues"} 0.001325488
node_scrape_collector_duration_seconds{collector="uname"} 7.0184e-05
node_scrape_collector_duration_seconds{collector="vmstat"} 0.000352664
node_scrape_collector_duration_seconds{collector="xfs"} 4.2481e-05
node_scrape_collector_duration_seconds{collector="zfs"} 0.00011237
# HELP node_scrape_collector_success node_exporter: Whether a collector succeeded.
# TYPE node_scrape_collector_success gauge
node_scrape_collector_success{collector="arp"} 0
node_scrape_collector_success{collector="bcache"} 1
node_scrape_collector_success{collector="bonding"} 0
node_scrape_collector_success{collector="btrfs"} 1
node_scrape_collector_success{collector="conntrack"} 0
node_scrape_collector_success{collector="cpu"} 1
node_scrape_collector_success{collector="cpufreq"} 1
node_scrape_collector_success{collector="diskstats"} 1
node_scrape_collector_success{collector="dmi"} 0
node_scrape_collector_success{collector="edac"} 1
node_scrape_collector_success{collector="entropy"} 1
node_scrape_collector_success{collector="fibrechannel"} 0
node_scrape_collector_success{collector="filefd"} 1
node_scrape_collector_success{collector="filesystem"} 1
node_scrape_collector_success{collector="hwmon"} 1
node_scrape_collector_success{collector="infiniband"} 0
node_scrape_collector_success{collector="ipvs"} 1
node_scrape_collector_success{collector="loadavg"} 1
node_scrape_collector_success{collector="mdadm"} 0
node_scrape_collector_success{collector="meminfo"} 1
node_scrape_collector_success{collector="netclass"} 1
node_scrape_collector_success{collector="netdev"} 1
node_scrape_collector_success{collector="netstat"} 1
node_scrape_collector_success{collector="nfs"} 1
node_scrape_collector_success{collector="nfsd"} 0
node_scrape_collector_success{collector="nvme"} 1
node_scrape_collector_success{collector="os"} 1
node_scrape_collector_success{collector="powersupplyclass"} 1
node_scrape_collector_success{collector="pressure"} 0
node_scrape_collector_success{collector="rapl"} 0
node_scrape_collector_success{collector="schedstat"} 1
node_scrape_collector_success{collector="selinux"} 1
node_scrape_collector_success{collector="sockstat"} 1
node_scrape_collector_success{collector="softnet"} 1
node_scrape_collector_success{collector="stat"} 1
node_scrape_collector_success{collector="tapestats"} 0
node_scrape_collector_success{collector="textfile"} 1
node_scrape_collector_success{collector="thermal_zone"} 1
node_scrape_collector_success{collector="time"} 1
node_scrape_collector_success{collector="timex"} 1
node_scrape_collector_success{collector="udp_queues"} 1
node_scrape_collector_success{collector="uname"} 1
node_scrape_collector_success{collector="vmstat"} 1
node_scrape_collector_success{collector="xfs"} 1
node_scrape_collector_success{collector="zfs"} 0
# HELP node_selinux_enabled SELinux is enabled, 1 is true, 0 is false
# TYPE node_selinux_enabled gauge
node_selinux_enabled 0
# HELP node_sockstat_FRAG6_inuse Number of FRAG6 sockets in state inuse.
# TYPE node_sockstat_FRAG6_inuse gauge
node_sockstat_FRAG6_inuse 0
# HELP node_sockstat_FRAG6_memory Number of FRAG6 sockets in state memory.
# TYPE node_sockstat_FRAG6_memory gauge
node_sockstat_FRAG6_memory 0
# HELP node_sockstat_FRAG_inuse Number of FRAG sockets in state inuse.
# TYPE node_sockstat_FRAG_inuse gauge
node_sockstat_FRAG_inuse 0
# HELP node_sockstat_FRAG_memory Number of FRAG sockets in state memory.
# TYPE node_sockstat_FRAG_memory gauge
node_sockstat_FRAG_memory 0
# HELP node_sockstat_RAW6_inuse Number of RAW6 sockets in state inuse.
# TYPE node_sockstat_RAW6_inuse gauge
node_sockstat_RAW6_inuse 1
# HELP node_sockstat_RAW_inuse Number of RAW sockets in state inuse.
# TYPE node_sockstat_RAW_inuse gauge
node_sockstat_RAW_inuse 0
# HELP node_sockstat_TCP6_inuse Number of TCP6 sockets in state inuse.
# TYPE node_sockstat_TCP6_inuse gauge
node_sockstat_TCP6_inuse 44
# HELP node_sockstat_TCP_alloc Number of TCP sockets in state alloc.
# TYPE node_sockstat_TCP_alloc gauge
node_sockstat_TCP_alloc 272
# HELP node_sockstat_TCP_inuse Number of TCP sockets in state inuse.
# TYPE node_sockstat_TCP_inuse gauge
node_sockstat_TCP_inuse 211
# HELP node_sockstat_TCP_mem Number of TCP sockets in state mem.
# TYPE node_sockstat_TCP_mem gauge
node_sockstat_TCP_mem 665
# HELP node_sockstat_TCP_mem_bytes Number of TCP sockets in state mem_bytes.
# TYPE node_sockstat_TCP_mem_bytes gauge
node_sockstat_TCP_mem_bytes 2.72384e+06
# HELP node_sockstat_TCP_orphan Number of TCP sockets in state orphan.
# TYPE node_sockstat_TCP_orphan gauge
node_sockstat_TCP_orphan 0
# HELP node_sockstat_TCP_tw Number of TCP sockets in state tw.
# TYPE node_sockstat_TCP_tw gauge
node_sockstat_TCP_tw 55
# HELP node_sockstat_UDP6_inuse Number of UDP6 sockets in state inuse.
# TYPE node_sockstat_UDP6_inuse gauge
node_sockstat_UDP6_inuse 2
# HELP node_sockstat_UDPLITE6_inuse Number of UDPLITE6 sockets in state inuse.
# TYPE node_sockstat_UDPLITE6_inuse gauge
node_sockstat_UDPLITE6_inuse 0
# HELP node_sockstat_UDPLITE_inuse Number of UDPLITE sockets in state inuse.
# TYPE node_sockstat_UDPLITE_inuse gauge
node_sockstat_UDPLITE_inuse 0
# HELP node_sockstat_UDP_inuse Number of UDP sockets in state inuse.
# TYPE node_sockstat_UDP_inuse gauge
node_sockstat_UDP_inuse 3
# HELP node_sockstat_UDP_mem Number of UDP sockets in state mem.
# TYPE node_sockstat_UDP_mem gauge
node_sockstat_UDP_mem 249
# HELP node_sockstat_UDP_mem_bytes Number of UDP sockets in state mem_bytes.
# TYPE node_sockstat_UDP_mem_bytes gauge
node_sockstat_UDP_mem_bytes 1.019904e+06
# HELP node_sockstat_sockets_used Number of IPv4 sockets in use.
# TYPE node_sockstat_sockets_used gauge
node_sockstat_sockets_used 563
# HELP node_softnet_backlog_len Softnet backlog status
# TYPE node_softnet_backlog_len gauge
node_softnet_backlog_len{cpu="0"} 0
node_softnet_backlog_len{cpu="1"} 0
node_softnet_backlog_len{cpu="2"} 0
node_softnet_backlog_len{cpu="3"} 0
# HELP node_softnet_cpu_collision_total Number of collision occur while obtaining device lock while transmitting
# TYPE node_softnet_cpu_collision_total counter
node_softnet_cpu_collision_total{cpu="0"} 0
node_softnet_cpu_collision_total{cpu="1"} 0
node_softnet_cpu_collision_total{cpu="2"} 0
node_softnet_cpu_collision_total{cpu="3"} 0
# HELP node_softnet_dropped_total Number of dropped packets
# TYPE node_softnet_dropped_total counter
node_softnet_dropped_total{cpu="0"} 0
node_softnet_dropped_total{cpu="1"} 0
node_softnet_dropped_total{cpu="2"} 0
node_softnet_dropped_total{cpu="3"} 0
# HELP node_softnet_flow_limit_count_total Number of times flow limit has been reached
# TYPE node_softnet_flow_limit_count_total counter
node_softnet_flow_limit_count_total{cpu="0"} 0
node_softnet_flow_limit_count_total{cpu="1"} 0
node_softnet_flow_limit_count_total{cpu="2"} 0
node_softnet_flow_limit_count_total{cpu="3"} 0
# HELP node_softnet_processed_total Number of processed packets
# TYPE node_softnet_processed_total counter
node_softnet_processed_total{cpu="0"} 3.91430308e+08
node_softnet_processed_total{cpu="1"} 7.0427743e+07
node_softnet_processed_total{cpu="2"} 7.2377954e+07
node_softnet_processed_total{cpu="3"} 7.0743949e+07
# HELP node_softnet_received_rps_total Number of times cpu woken up received_rps
# TYPE node_softnet_received_rps_total counter
node_softnet_received_rps_total{cpu="0"} 0
node_softnet_received_rps_total{cpu="1"} 0
node_softnet_received_rps_total{cpu="2"} 0
node_softnet_received_rps_total{cpu="3"} 0
# HELP node_softnet_times_squeezed_total Number of times processing packets ran out of quota
# TYPE node_softnet_times_squeezed_total counter
node_softnet_times_squeezed_total{cpu="0"} 298183
node_softnet_times_squeezed_total{cpu="1"} 0
node_softnet_times_squeezed_total{cpu="2"} 0
node_softnet_times_squeezed_total{cpu="3"} 0
# HELP node_textfile_scrape_error 1 if there was an error opening or reading a file, 0 otherwise
# TYPE node_textfile_scrape_error gauge
node_textfile_scrape_error 0
# HELP node_thermal_zone_temp Zone temperature in Celsius
# TYPE node_thermal_zone_temp gauge
node_thermal_zone_temp{type="cpu-thermal",zone="0"} 28.232
# HELP node_time_clocksource_available_info Available clocksources read from '/sys/devices/system/clocksource'.
# TYPE node_time_clocksource_available_info gauge
node_time_clocksource_available_info{clocksource="arch_sys_counter",device="0"} 1
# HELP node_time_clocksource_current_info Current clocksource read from '/sys/devices/system/clocksource'.
# TYPE node_time_clocksource_current_info gauge
node_time_clocksource_current_info{clocksource="arch_sys_counter",device="0"} 1
# HELP node_time_seconds System time in seconds since epoch (1970).
# TYPE node_time_seconds gauge
node_time_seconds 1.7097658934862518e+09
# HELP node_time_zone_offset_seconds System time zone offset in seconds.
# TYPE node_time_zone_offset_seconds gauge
node_time_zone_offset_seconds{time_zone="UTC"} 0
# HELP node_timex_estimated_error_seconds Estimated error in seconds.
# TYPE node_timex_estimated_error_seconds gauge
node_timex_estimated_error_seconds 0
# HELP node_timex_frequency_adjustment_ratio Local clock frequency adjustment.
# TYPE node_timex_frequency_adjustment_ratio gauge
node_timex_frequency_adjustment_ratio 0.9999922578277588
# HELP node_timex_loop_time_constant Phase-locked loop time constant.
# TYPE node_timex_loop_time_constant gauge
node_timex_loop_time_constant 7
# HELP node_timex_maxerror_seconds Maximum error in seconds.
# TYPE node_timex_maxerror_seconds gauge
node_timex_maxerror_seconds 0.672
# HELP node_timex_offset_seconds Time offset in between local system and reference clock.
# TYPE node_timex_offset_seconds gauge
node_timex_offset_seconds -0.000593063
# HELP node_timex_pps_calibration_total Pulse per second count of calibration intervals.
# TYPE node_timex_pps_calibration_total counter
node_timex_pps_calibration_total 0
# HELP node_timex_pps_error_total Pulse per second count of calibration errors.
# TYPE node_timex_pps_error_total counter
node_timex_pps_error_total 0
# HELP node_timex_pps_frequency_hertz Pulse per second frequency.
# TYPE node_timex_pps_frequency_hertz gauge
node_timex_pps_frequency_hertz 0
# HELP node_timex_pps_jitter_seconds Pulse per second jitter.
# TYPE node_timex_pps_jitter_seconds gauge
node_timex_pps_jitter_seconds 0
# HELP node_timex_pps_jitter_total Pulse per second count of jitter limit exceeded events.
# TYPE node_timex_pps_jitter_total counter
node_timex_pps_jitter_total 0
# HELP node_timex_pps_shift_seconds Pulse per second interval duration.
# TYPE node_timex_pps_shift_seconds gauge
node_timex_pps_shift_seconds 0
# HELP node_timex_pps_stability_exceeded_total Pulse per second count of stability limit exceeded events.
# TYPE node_timex_pps_stability_exceeded_total counter
node_timex_pps_stability_exceeded_total 0
# HELP node_timex_pps_stability_hertz Pulse per second stability, average of recent frequency changes.
# TYPE node_timex_pps_stability_hertz gauge
node_timex_pps_stability_hertz 0
# HELP node_timex_status Value of the status array bits.
# TYPE node_timex_status gauge
node_timex_status 24577
# HELP node_timex_sync_status Is clock synchronized to a reliable server (1 = yes, 0 = no).
# TYPE node_timex_sync_status gauge
node_timex_sync_status 1
# HELP node_timex_tai_offset_seconds International Atomic Time (TAI) offset.
# TYPE node_timex_tai_offset_seconds gauge
node_timex_tai_offset_seconds 0
# HELP node_timex_tick_seconds Seconds between clock ticks.
# TYPE node_timex_tick_seconds gauge
node_timex_tick_seconds 0.01
# HELP node_udp_queues Number of allocated memory in the kernel for UDP datagrams in bytes.
# TYPE node_udp_queues gauge
node_udp_queues{ip="v4",queue="rx"} 0
node_udp_queues{ip="v4",queue="tx"} 0
node_udp_queues{ip="v6",queue="rx"} 0
node_udp_queues{ip="v6",queue="tx"} 0
# HELP node_uname_info Labeled system information as provided by the uname system call.
# TYPE node_uname_info gauge
node_uname_info{domainname="(none)",machine="aarch64",nodename="bettley",release="6.1.0-rpi7-rpi-v8",sysname="Linux",version="#1 SMP PREEMPT Debian 1:6.1.63-1+rpt1 (2023-11-24)"} 1
# HELP node_vmstat_oom_kill /proc/vmstat information field oom_kill.
# TYPE node_vmstat_oom_kill untyped
node_vmstat_oom_kill 0
# HELP node_vmstat_pgfault /proc/vmstat information field pgfault.
# TYPE node_vmstat_pgfault untyped
node_vmstat_pgfault 3.706999478e+09
# HELP node_vmstat_pgmajfault /proc/vmstat information field pgmajfault.
# TYPE node_vmstat_pgmajfault untyped
node_vmstat_pgmajfault 5791
# HELP node_vmstat_pgpgin /proc/vmstat information field pgpgin.
# TYPE node_vmstat_pgpgin untyped
node_vmstat_pgpgin 1.115617e+06
# HELP node_vmstat_pgpgout /proc/vmstat information field pgpgout.
# TYPE node_vmstat_pgpgout untyped
node_vmstat_pgpgout 2.55770725e+08
# HELP node_vmstat_pswpin /proc/vmstat information field pswpin.
# TYPE node_vmstat_pswpin untyped
node_vmstat_pswpin 0
# HELP node_vmstat_pswpout /proc/vmstat information field pswpout.
# TYPE node_vmstat_pswpout untyped
node_vmstat_pswpout 0
# HELP process_cpu_seconds_total Total user and system CPU time spent in seconds.
# TYPE process_cpu_seconds_total counter
process_cpu_seconds_total 0.05
# HELP process_max_fds Maximum number of open file descriptors.
# TYPE process_max_fds gauge
process_max_fds 1.048576e+06
# HELP process_open_fds Number of open file descriptors.
# TYPE process_open_fds gauge
process_open_fds 9
# HELP process_resident_memory_bytes Resident memory size in bytes.
# TYPE process_resident_memory_bytes gauge
process_resident_memory_bytes 1.2292096e+07
# HELP process_start_time_seconds Start time of the process since unix epoch in seconds.
# TYPE process_start_time_seconds gauge
process_start_time_seconds 1.7097658257e+09
# HELP process_virtual_memory_bytes Virtual memory size in bytes.
# TYPE process_virtual_memory_bytes gauge
process_virtual_memory_bytes 1.269604352e+09
# HELP process_virtual_memory_max_bytes Maximum amount of virtual memory available in bytes.
# TYPE process_virtual_memory_max_bytes gauge
process_virtual_memory_max_bytes 1.8446744073709552e+19
# HELP promhttp_metric_handler_errors_total Total number of internal errors encountered by the promhttp metric handler.
# TYPE promhttp_metric_handler_errors_total counter
promhttp_metric_handler_errors_total{cause="encoding"} 0
promhttp_metric_handler_errors_total{cause="gathering"} 0
# HELP promhttp_metric_handler_requests_in_flight Current number of scrapes being served.
# TYPE promhttp_metric_handler_requests_in_flight gauge
promhttp_metric_handler_requests_in_flight 1
# HELP promhttp_metric_handler_requests_total Total number of scrapes by HTTP status code.
# TYPE promhttp_metric_handler_requests_total counter
promhttp_metric_handler_requests_total{code="200"} 0
promhttp_metric_handler_requests_total{code="500"} 0
promhttp_metric_handler_requests_total{code="503"} 0
So... yay?
We could shift this to a separate repository, or we can just rip it back out of the incubator and create a separate Application resource for it in this task file. We could organize it a thousand different ways. A prometheus_node_exporter repository? A prometheus repository? A monitoring repository?
Because I'm not really sure which I'd like to do, I'll just defer the decision until a later date and move on to other things.
Router BGP Configuration
Before I go too much further, I want to get load balancer services working.
With major cloud vendors that support Kubernetes, creating a service of type LoadBalancer will create a load balancer within that platform that provides external access to that service. This spares us from having to use ClusterIP, etc, to access our services.
This functionality isn't automatically available in a homelab. Why would it be? How could it know what you want? Regardless of the complexities preventing this from Just Working™, this topic is often a source of irritation to the homelabber.
Fortunately, a gentleman and scholar named Dave Anderson spent (I assume) a significant amount of time and devised a system, MetalLB, to bring load balancer functionality to bare metal clusters.
With a reasonable amount of effort, we can configure a router supporting BGP and a Kubernetes cluster running MetalLB into a pretty clean network infrastructure.
In my case, this starts with configuring my router/firewall (running OPNsense) to support BGP.
This means installing the os-frr (for "Free-Range Routing") plugin:
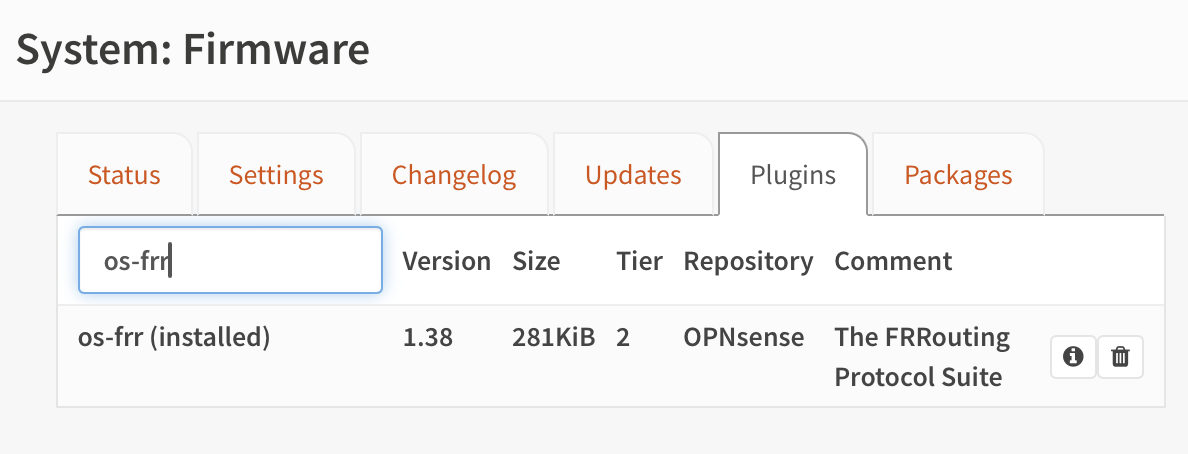
Then we enable routing:
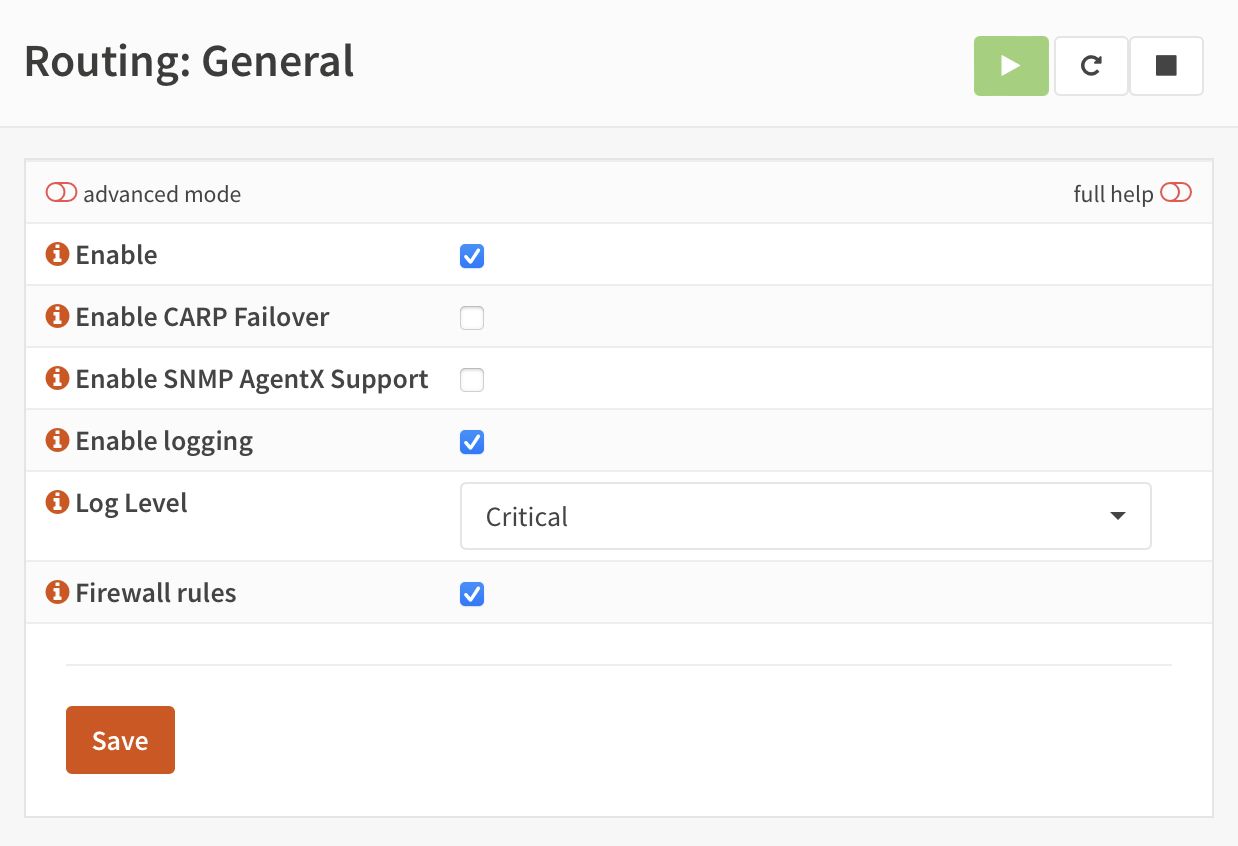
Then we enable BGP. We give the router an AS number of 64500.
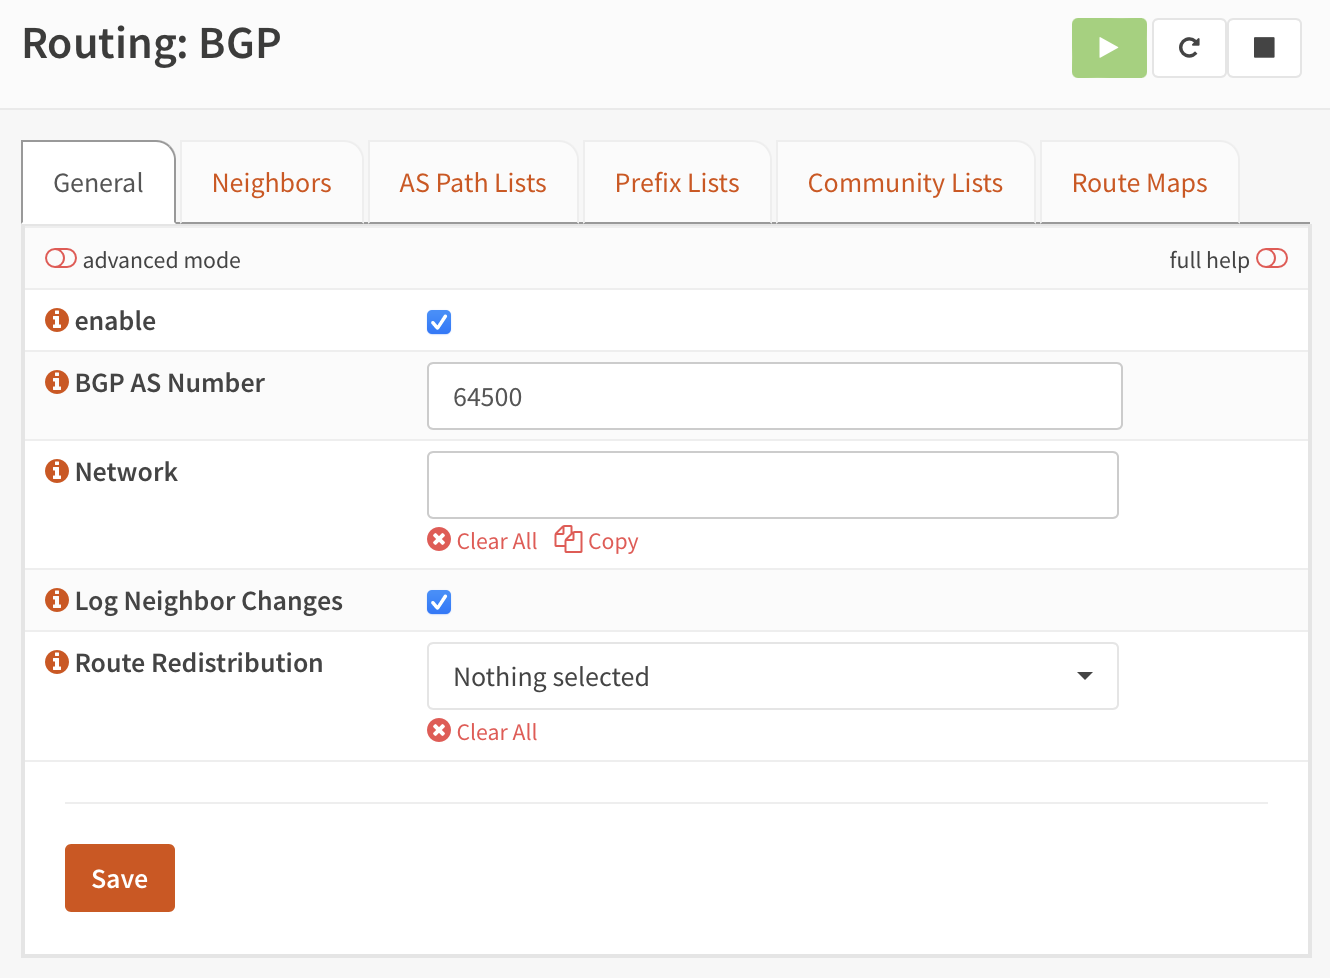
Then we add each of the nodes that might run MetalLB "speakers" as neighbors. They all will share a single AS number, 64501.
In the next section, we'll configure MetalLB.
MetalLB
MetalLB requires that its namespace have some extra privileges:
  apiVersion: 'v1'
  kind: 'Namespace'
  metadata:
    name: 'metallb'
    labels:
      name: 'metallb'
      managed-by: 'argocd'
      pod-security.kubernetes.io/enforce: privileged
      pod-security.kubernetes.io/audit: privileged
      pod-security.kubernetes.io/warn: privileged
Its application is (perhaps surprisingly) rather simple to configure:
apiVersion: 'argoproj.io/v1alpha1'
kind: 'Application'
metadata:
  name: 'metallb'
  namespace: 'argocd'
  labels:
    name: 'metallb'
    managed-by: 'argocd'
spec:
  project: 'metallb'
  source:
    repoURL: 'https://metallb.github.io/metallb'
    chart: 'metallb'
    targetRevision: '0.14.3'
    helm:
      releaseName: 'metallb'
      valuesObject:
        rbac:
          create: true
        prometheus:
          scrapeAnnotations: true
          metricsPort: 7472
          rbacPrometheus: true
  destination:
    server: 'https://kubernetes.default.svc'
    namespace: 'metallb'
  syncPolicy:
    automated:
      prune: true
      selfHeal: true
    syncOptions:
      - Validate=true
      - CreateNamespace=false
      - PrunePropagationPolicy=foreground
      - PruneLast=true
      - RespectIgnoreDifferences=true
      - ApplyOutOfSyncOnly=true
It does require some extra resources, though. The first of these is an address pool from which to allocate IP addresses. It's important that this not overlap with a DHCP pool.
The full network is 10.4.0.0/20 and I've configured the DHCP server to only serve addresses in 10.4.0.100-254, so we have plenty of space to play with. Right now, I'll use 10.4.11.0-10.4.15.254, which gives ~1250 usable addresses. I don't think I'll use quite that many.
apiVersion: 'metallb.io/v1beta1'
kind: 'IPAddressPool'
metadata:
  name: 'primary'
  namespace: 'metallb'
spec:
  addresses:
  - 10.4.11.0 - 10.4.15.254
Then we need to configure MetalLB to act as a BGP peer:
apiVersion: 'metallb.io/v1beta2'
kind: 'BGPPeer'
metadata:
  name: 'marbrand'
  namespace: 'metallb'
spec:
  myASN: 64501
  peerASN: 64500
  peerAddress: 10.4.0.1
And advertise the IP address pool:
apiVersion: 'metallb.io/v1beta1'
kind: 'BGPAdvertisement'
metadata:
  name: 'primary'
  namespace: 'metallb'
spec:
  ipAddressPools:
    - 'primary'
That's that; we can deploy it, and soon we'll be up and running, although we can't yet test it.
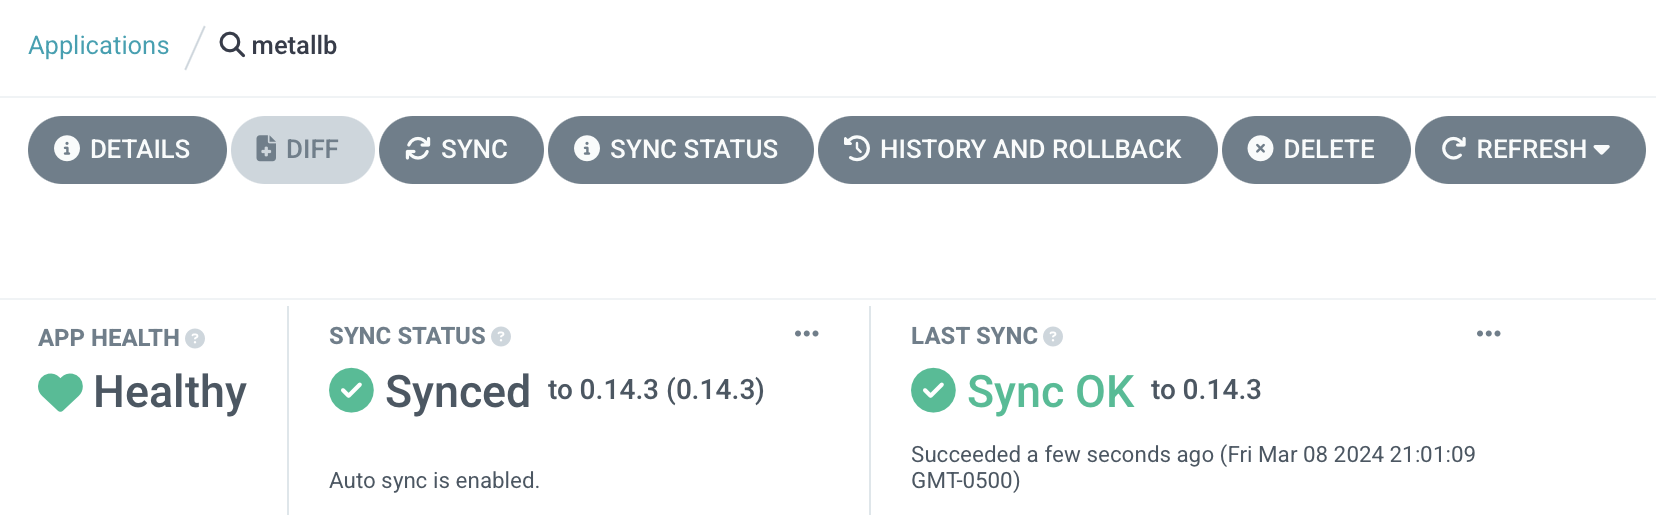
Testing MetalLB
The simplest way to test MetalLB is just to deploy an application with a LoadBalancer service and see if it works.
I'm a fan of httpbin and its Go port, httpbingo, so up it goes:
apiVersion: 'argoproj.io/v1alpha1'
kind: 'Application'
metadata:
  name: 'httpbin'
  namespace: 'argocd'
  labels:
    name: 'httpbin'
    managed-by: 'argocd'
spec:
  project: 'httpbin'
  source:
    repoURL: 'https://matheusfm.dev/charts'
    chart: 'httpbin'
    targetRevision: '0.1.1'
    helm:
      releaseName: 'httpbin'
      valuesObject:
        service:
          type: 'LoadBalancer'
  destination:
    server: 'https://kubernetes.default.svc'
    namespace: 'httpbin'
  syncPolicy:
    automated:
      prune: true
      selfHeal: true
    syncOptions:
      - Validate=true
      - CreateNamespace=true
      - PrunePropagationPolicy=foreground
      - PruneLast=true
      - RespectIgnoreDifferences=true
      - ApplyOutOfSyncOnly=true
Very quickly, it's synced:
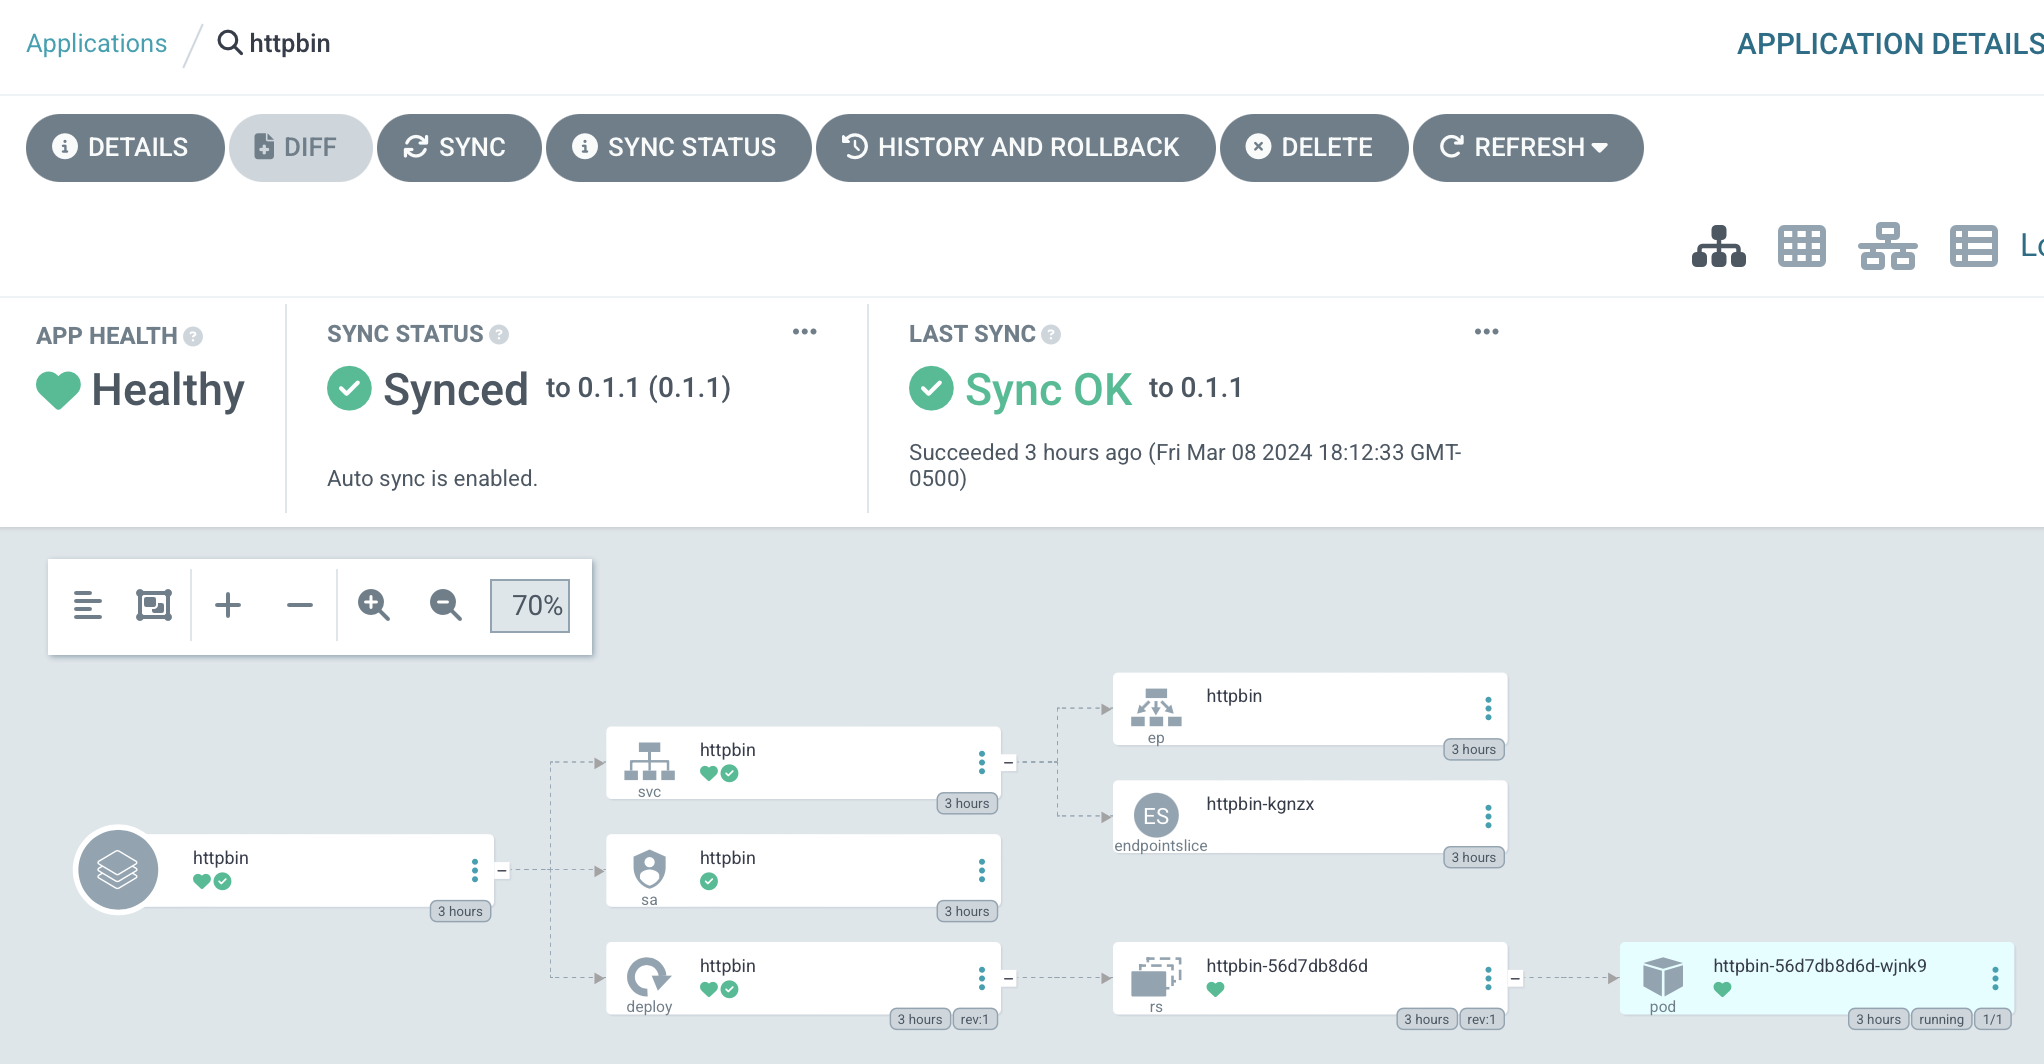
We can get the IP address allocated for the load balancer with kubectl -n httpbin get svc:
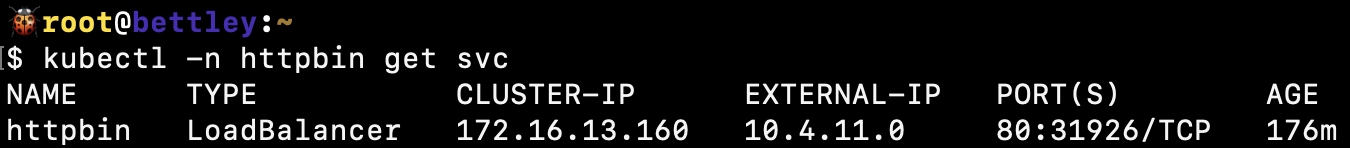
And sure enough, it's allocated from the IP address pool we specified. That seems like an excellent sign!
Can we access it from a web browser running on a computer on a different network?
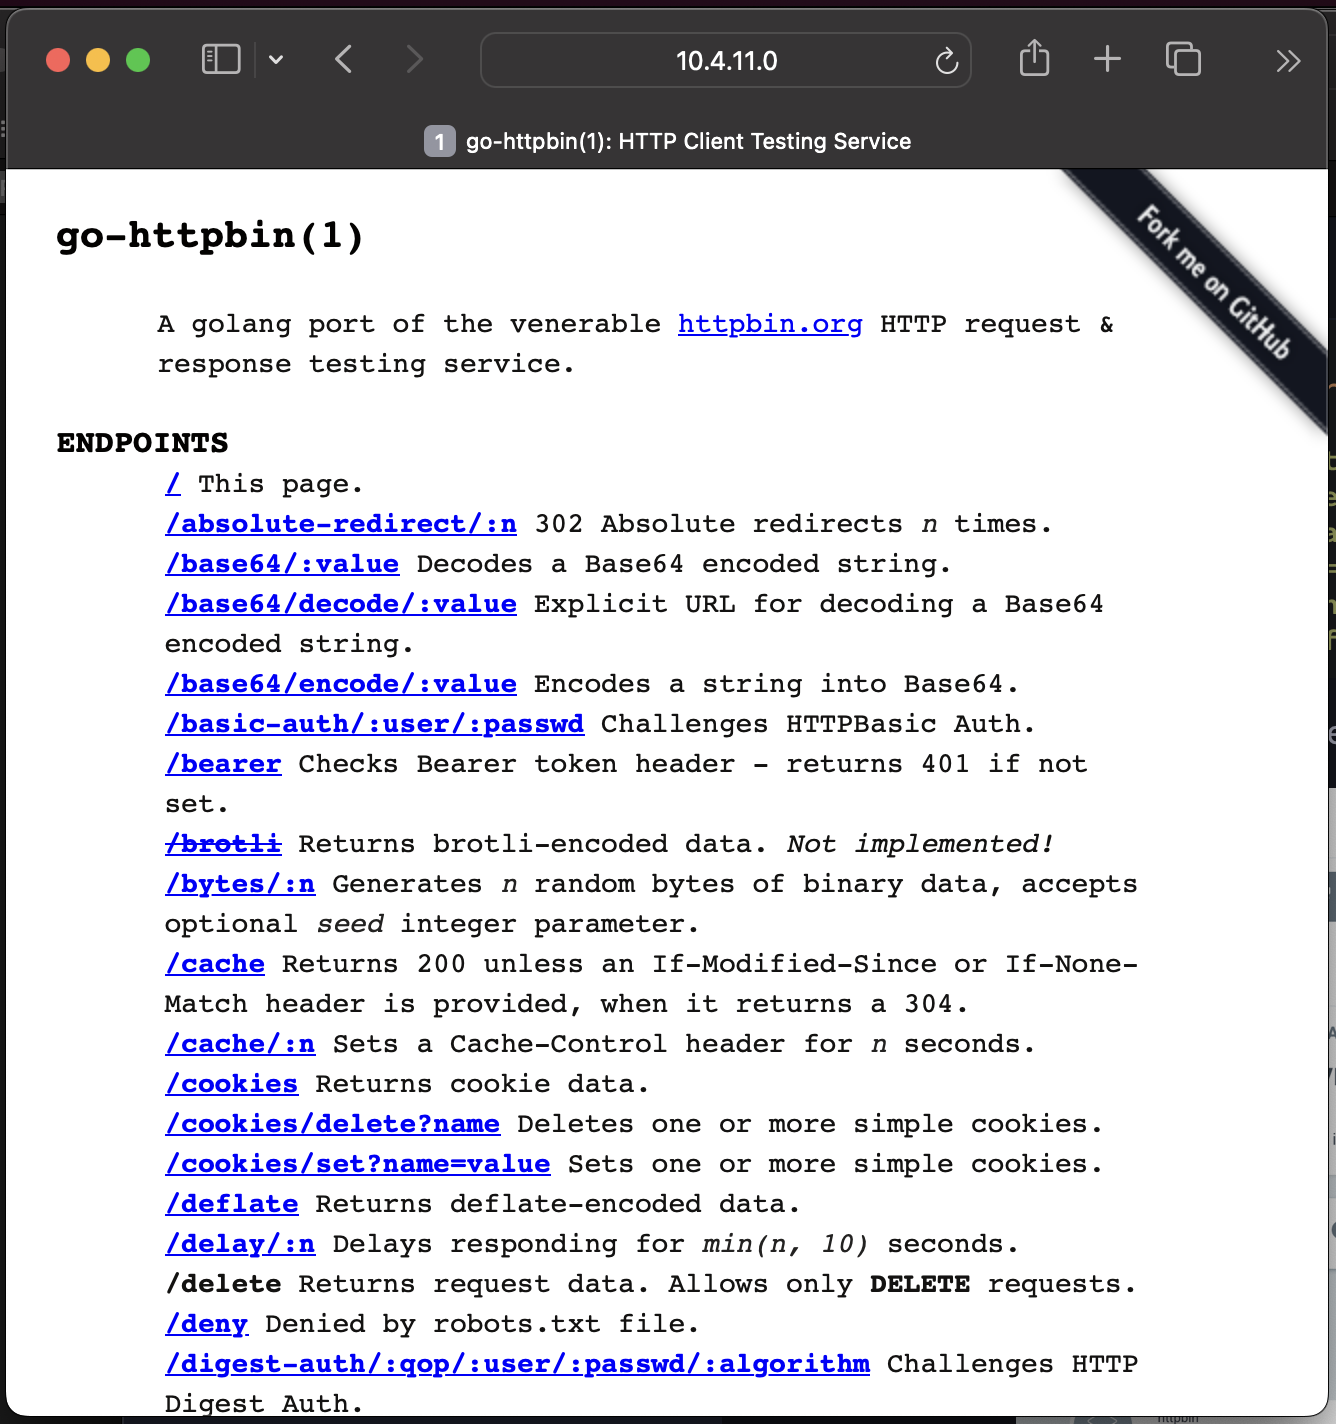
Yes, we can! Our load balancer system is working!
Refactoring Argo CD
We're only a few projects in, and using Ansible to install our Argo CD applications seems a bit weak. It's not very GitOps-y to run a Bash command that runs an Ansible playbook that kubectls some manifests into our Kubernetes cluster.
In fact, the less we mess with Argo CD itself, the better. Eventually, we'll be able to create a repository on GitHub and see resources appear within our Kubernetes cluster without having to touch Argo CD at all!
We'll do this by using the power of ApplicationSet resources.
First, we'll create a secret to hold a GitHub token. This part is optional, but it'll allow us to use the API more.
Second, we'll create an AppProject to encompass these applications. It'll have pretty broad permissions at first, though I'll try and tighten them up a bit.
apiVersion: 'argoproj.io/v1alpha1'
kind: 'AppProject'
metadata:
  name: 'gitops-repo'
  namespace: 'argocd'
  finalizers:
    - 'resources-finalizer.argocd.argoproj.io'
spec:
  description: 'GoldenTooth GitOps-Repo project'
  sourceRepos:
    - '*'
  destinations:
    - namespace: '!kube-system'
      server: '*'
    - namespace: '*'
      server: '*'
  clusterResourceWhitelist:
    - group: '*'
      kind: '*'
Then an ApplicationSet.
apiVersion: 'argoproj.io/v1alpha1'
kind: 'ApplicationSet'
metadata:
  name: 'gitops-repo'
  namespace: 'argocd'
spec:
  generators:
    - scmProvider:
        github:
          organization: 'goldentooth'
          tokenRef:
            secretName: 'github-token'
            key: 'token'
        filters:
          - labelMatch: 'gitops-repo'
  template:
    goTemplate: true
    goTemplateOptions: ["missingkey=error"]
    metadata:
      # Prefix name with `gitops-repo-`.
      # This allows us to define the `Application` manifest within the repo and
      # have significantly greater flexibility, at the cost of an additional
      # application in the Argo CD UI.
      name: 'gitops-repo-{{ .repository }}'
    spec:
      source:
        repoURL: '{{ .url }}'
        targetRevision: '{{ .branch }}'
        path: './'
      project: 'gitops-repo'
      destination:
        server: https://kubernetes.default.svc
        namespace: '{{ .repository }}'
The idea is that I'll create a repository and give it a topic of gitops-repo. This will be matched by the labelMatch filter, and then Argo CD will deploy whatever manifests it finds there.
MetalLB is the natural place to start.
We don't actually have to do that much to get this working:
- Create a new repository
metallb. - Add a
Chart.yamlfile with some boilerplate. - Add the manifests to a
templates/directory. - Add a
values.yamlfile with values to substitute into the manifests. - As mentioned above, edit the repo to give it the
gitops-repotopic.
Within a few minutes, Argo CD will notice the changes and deploy a gitops-repo-metallb application:
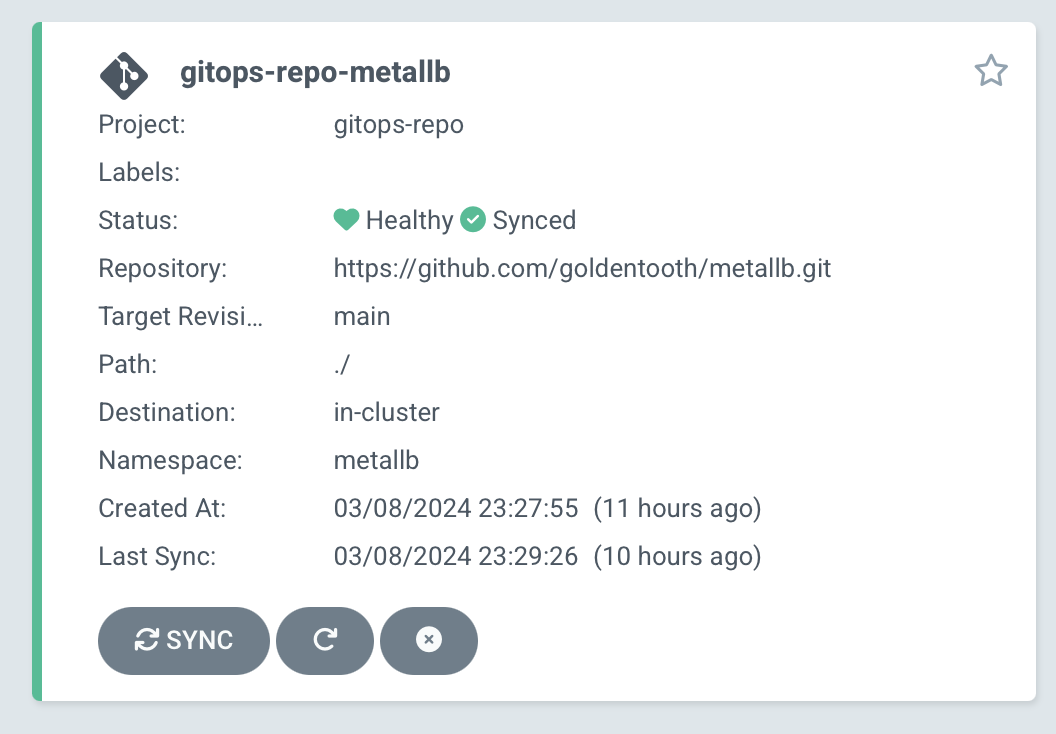
If we click into it, we'll see the resources deployed by the manifests within the repository:
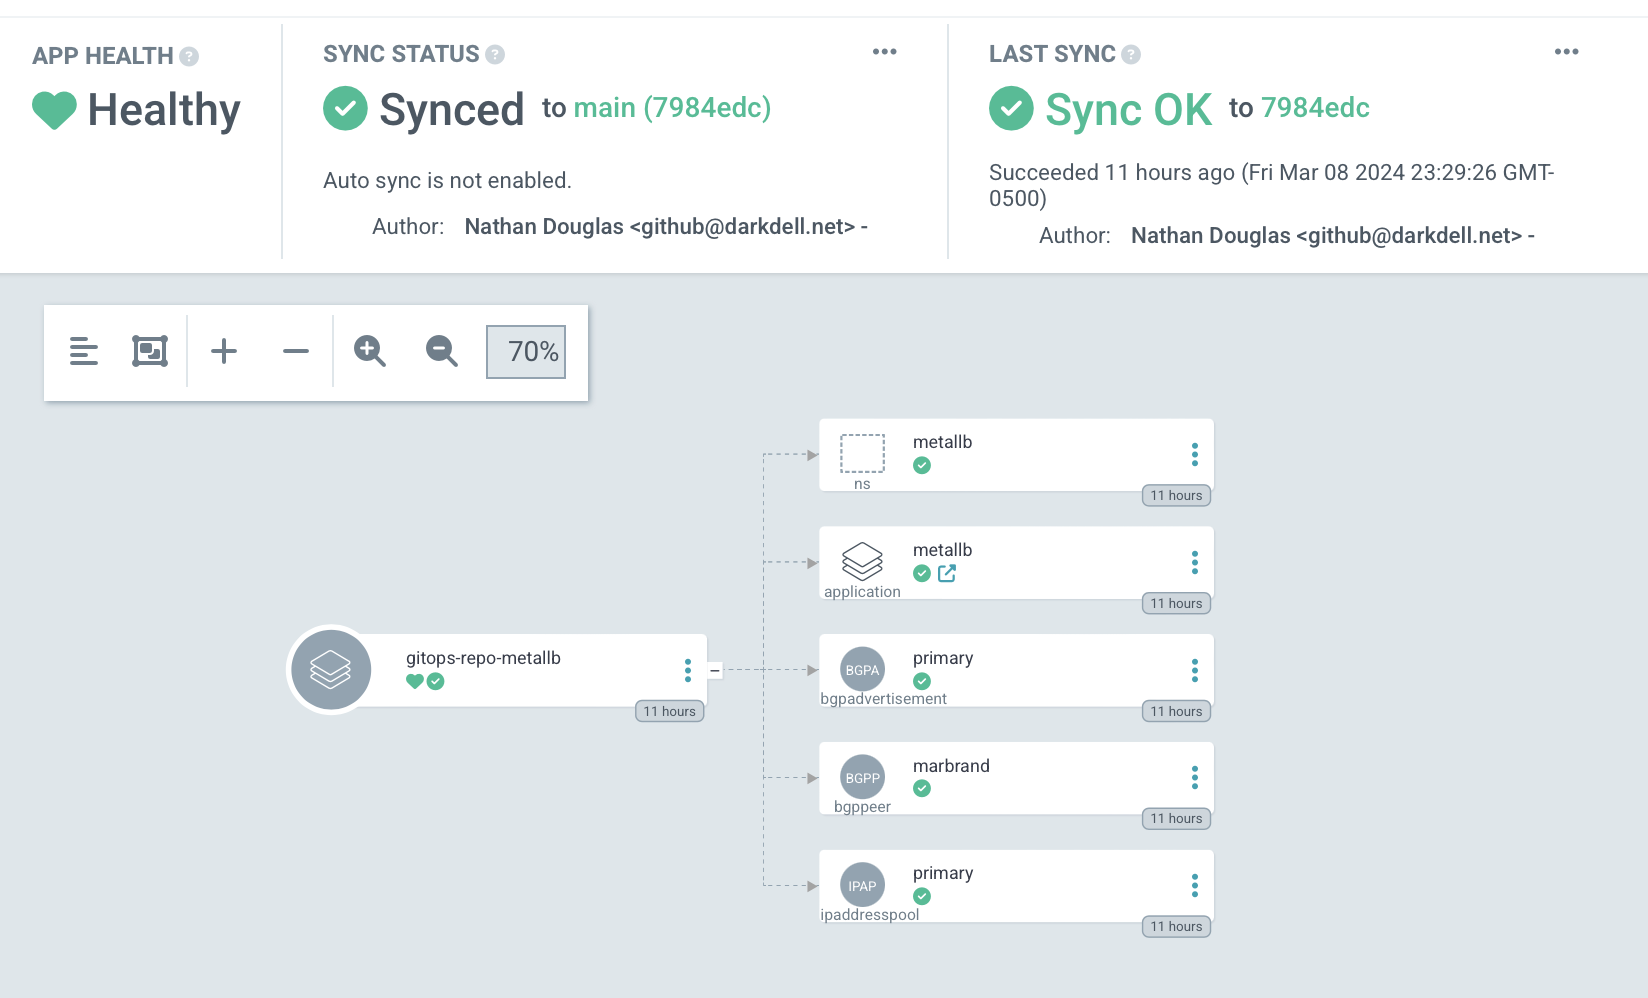
So we see the resources we created previously for the BGPPeer, IPAddressPool, and BGPAdvertisement. We also see an Application, metallb, which we can also see in the general Applications overview in Argo CD:
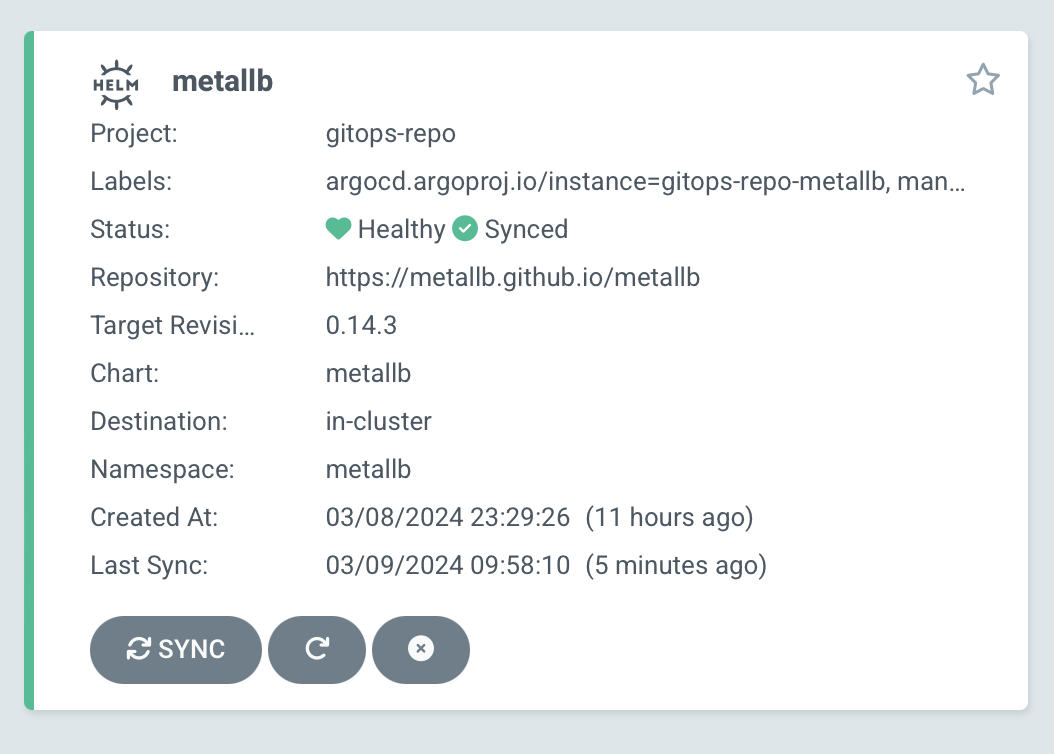
Clicking into it, we'll see all of the resources deployed by the metallb Helm chart we referenced.
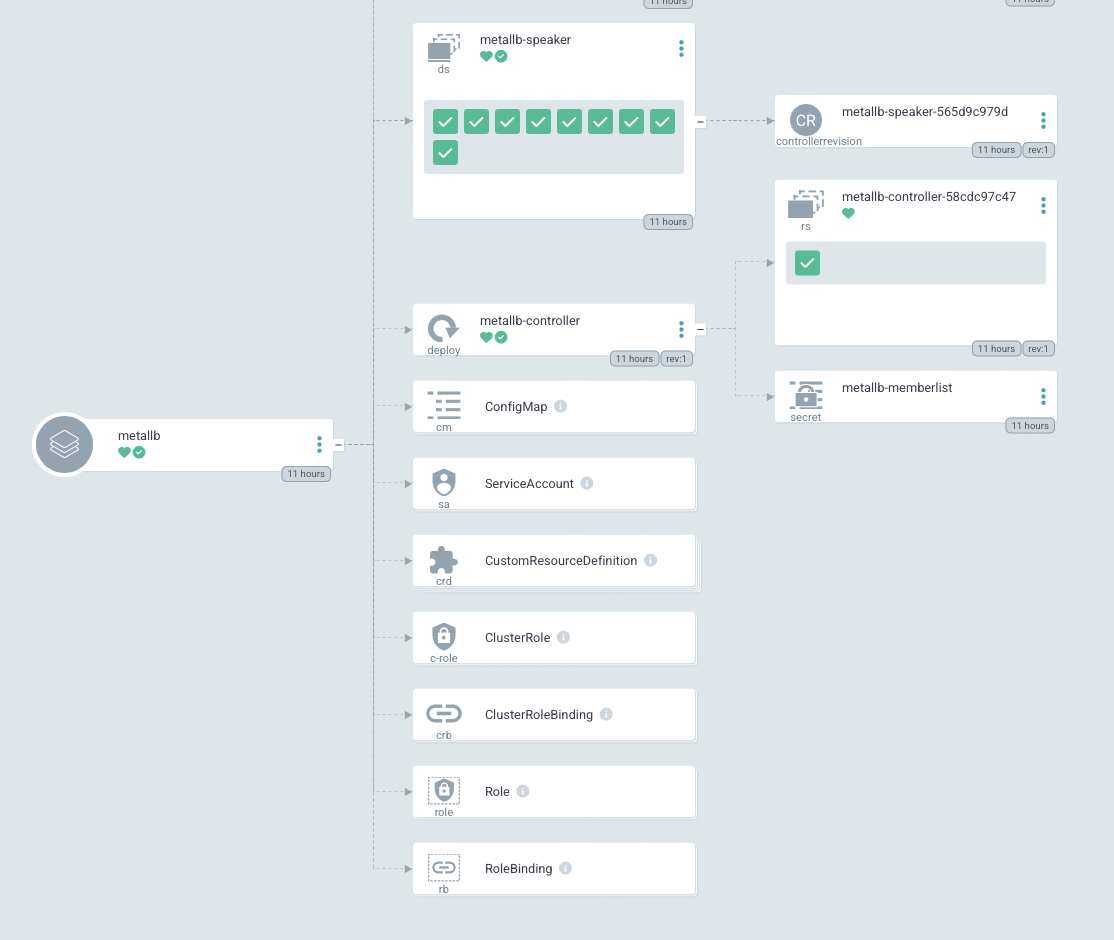
A quick test to verify that our httpbin application is still assigned a working load balancer, and we can declare victory!
While I'm here, I might as well shift httpbin and prometheus-node-exporter as well...
Giving Argo CD a Load Balancer
All this time, the Argo CD server has been operating with a ClusterIP service, and I've been manually port forwarding it via kubectl to be able to show all of these beautiful screenshots of the web UI.
That's annoying and we don't have to do it anymore. Fortunately, it's very easy to change this now; all we need to do is modify the Helm release values slightly; change server.service.type from 'ClusterIP' to 'LoadBalancer' and redeploy. A few minutes later, we can access Argo CD via http://10.4.11.1, no port forwarding required.
ExternalDNS
The workflow for accessing our LoadBalancer services ain't great.
If we deploy a new application, we need to run kubectl -n <namespace> get svc and read through a list to determine the IP address on which it's exposed. And that's not going to be stable; there's nothing at all guaranteeing that Argo CD will always be available at http://10.4.11.1.
Enter ExternalDNS. The idea is that we annotate our services with external-dns.alpha.kubernetes.io/hostname: "argocd.my-cluster.my-domain.com" and a DNS record will be created pointing to the actual IP address of the LoadBalancer service.
This is comparatively straightforward to configure if you host your DNS in one of the supported services. I host mine via AWS Route53, which is supported.
The complication is that we don't yet have a great way of managing secrets, so there's a manual step here that I find unpleasant, but we'll cross that bridge when we get to it.
Because of work we've done previously with Argo CD, we can just create a new repository to deploy ExternalDNS within our cluster.
This has the following manifests:
- Deployment: The deployment has several interesting features:
- This is where the
--provider(aws) is configured. - We specify
--sources (in our caseservice). - A
--domain-filterallows us to use different configurations for different domain names. - A
--txt-owner-idallows us to map from a record back to the application that created it. - Mounts a secret as AWS credentials (I used static credentials for the time being) so ExternalDNS can make the changes in Route53.
- This is where the
- ServiceAccount: Just adds a service account for ExternalDNS.
- ClusterRole: Describes an ability to observe changes in services.
- ClusterRoleBinding: Binds the above cluster role and ExternalDNS.
A few minutes after pushing changes to the repository, we can reach Argo CD via https://argocd.goldentooth.hellholt.net/.
Killing the Incubator
At this point, given the ease of spinning up new applications with the gitops-repo ApplicationSet, there's really not much benefit to the Incubator app-of-apps repo.
I'd also added a way of easily spinning up generic projects, but I don't think that's necessary either. The ApplicationSet approach is really pretty powerful 🙂